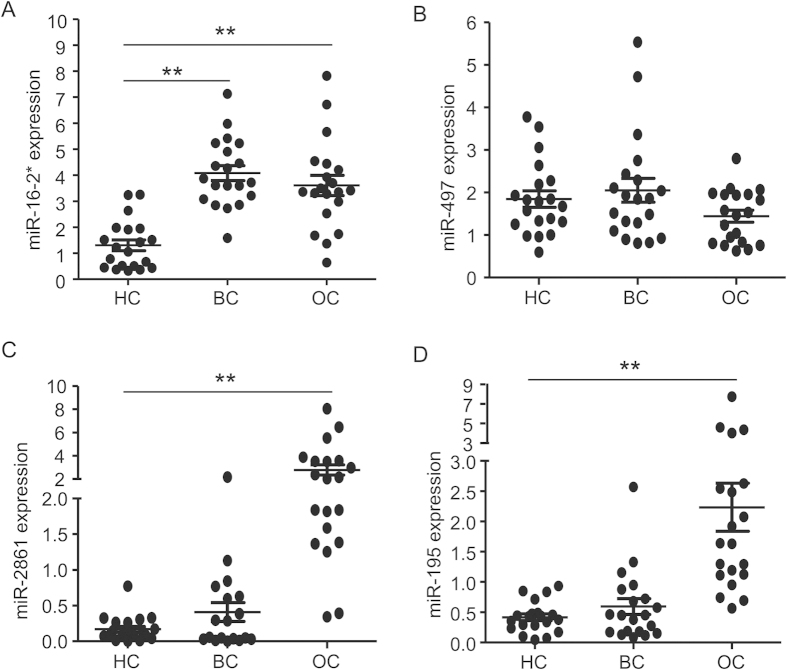
Figure 3. Expression profiles of the miRNA panel in breast cancer and ovarian cancer.
Expression profiles of miR-16-2*, miR-195, miR-2861 and miR-497 were performed in healthy subjects (HC), breast cancer (BC) and ovarian cancer (OC). P values were calculated using the Mann-Whitney test. ns, not significant; *p < 0.05; **p < 0.01; ***p < 0.001.

