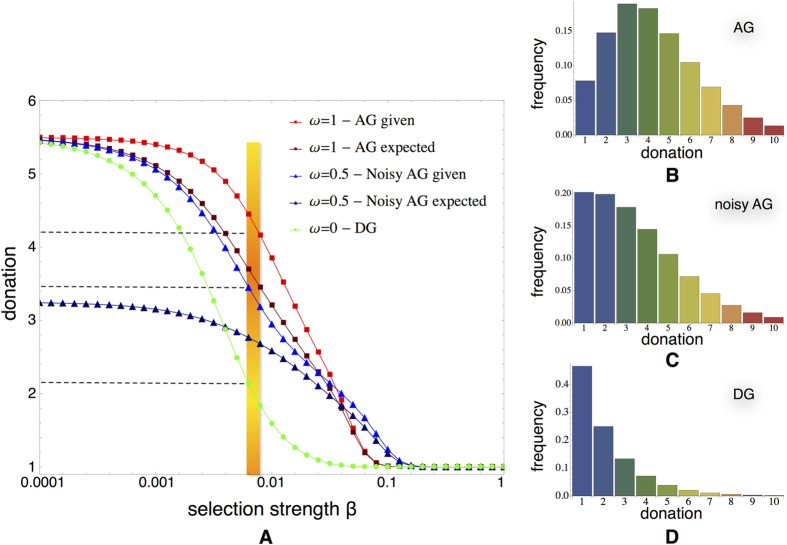
Figure 2.
(A) Average donations given from the dictators and expected by the receivers with respect to the selection parameter β and the probability ω of knowing the dictator’s previous action according to the stochastic evolutionary dynamics model (low mutation rate  . The dictators almost always give more when the approval of the matching lies on the receivers side, apart from when selection gets strong enough leading to the subgame perfect equilibrium outcome. Furthermore the latter, expect less than the amount they will finally receive (always
  . Black horizontal dashed lines correspond to the average donations observed in the experiments, around 4.2 in AG, 3.5 in noisy AG and 2.2 in DG, and the yellow background indicates this β area fitting them best. The distributions of the strategies of dictators are shown for the AG (panel (B)), its noisy variation (panel (C)), and finally the DG (panel (D)). A more detailed analysis of the DG strategy distribution can be seen in Figure S3 in Supplementary Material.

