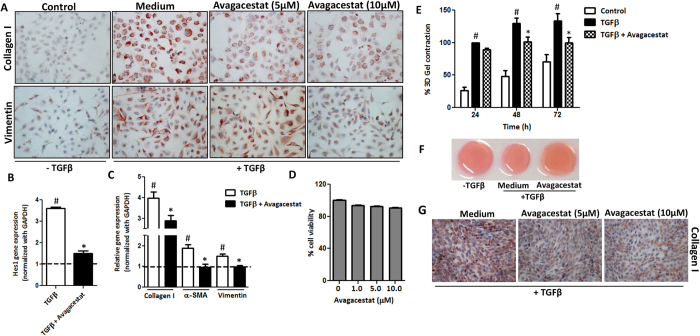
Figure 3. Effect of Notch inhibition on the activation and contractility of TGFβ-activated human HSCs.
(A) Representative images (scale bars, 200 μm) of collagen I and vimentin stained LX2 cells treated with medium alone (control), TGFβ (5 ng/ml) ± 5 μM or 10 μM Notch inhibitor (Avagacestat). Quantitative gene expression analysis (normalized with GAPDH) of (B) Notch signaling molecule Hes1, (C) Fibrotic parameters: collagen I, α-SMA and Vimentin on LX2 cells treated with medium alone (control expressed as dotted line), TGFβ (5 ng/ml) ± 10 μM Avagacestat. (D) Graph showing % cell viability performed on LX2 cells incubated with increasing concentrations of Avagacestat. (E) Graph depicts % 3D-collagen-I gel contraction after 24, 48 and 72 h of treatment with medium alone (control), TGFβ (5 ng/ml) ± 10 μM Avagacestat. (F) Representative microscopic images of the contracted collagen gels after 72 h of treatments. (G) Representative pictures (scale bars, 200 μm) of collagen I stained mouse 3T3 fibroblasts treated with medium alone (control), TGFβ (5 ng/ml) ± 5 μM or 10 μM Avagacestat. Bars represent mean ± SEM of atleast three independent experiments. #p < 0.05 denotes significance versus respective control cells; *p < 0.05 denotes significance versus TGFβ-treated cells.

