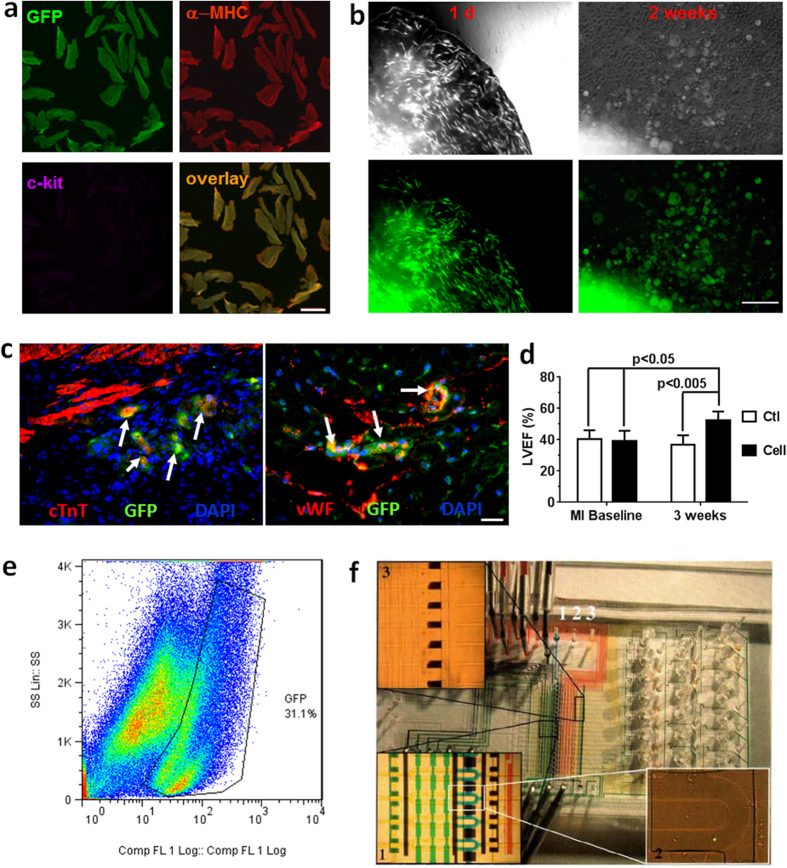
Figure 1. Cardiomyocyte dedifferentiation, re-differentiation, and isolation of single cells for whole-transcriptome analysis.
(a) Immunocytochemistry showing cardiac-specific labeling of GFP (green) in mature myocytes expressing α-MHC (red) but not c-kit (magenta). Adult cardiomyocytes were isolated from bi-transgenic αMHC-MerCreMer Z/EG mouse hearts after tamoxifen-induced gene recombination (see Methods for detail). Scale bar, 200 μm. (b) Phase contrast images (upper panels) and fluorescent images (lower panels, Green- GFP) of transgenic cardiac tissue and derived cells at the beginning of culture (1d) and at 2 weeks of culture. Scale bar, 200 μm. (c) Confocal microscope images showing the re-differentiation of GFP-mCPCs (green) into cardiomyocytes expressing cardiac troponin (cTnT, red; white arrows, left panel) and endothelial cells expressing von Willebrand factor (VWF, red; white arrows, right panel) 3 weeks after implantation into the infarcted myocardium of wild-type background mice. Nuclei were stained with DAPI (blue). Scale bar, 100 μm. (d) Left ventricular ejection fraction (LVEF) measured at baseline after myocardial infarction (MI) surgery and 3 week post-MI using echocardiography. Vehicle media (Ctl) was used as a control for GFP-mCPC cell transplantation (Cell). N = 5 mice for Ctl group, and 6 mice for Cell group. (e) Flow cytometry analysis of cardiac explant cultures at 2 weeks showing about 30% cells are GFP positive in the whole population. (f) Custom phase-switch microfluidic chip for the isolation of single mCPCs. Individual live single-cell can be encapsulated into as little as 500-pl droplet for downstream analysis.

