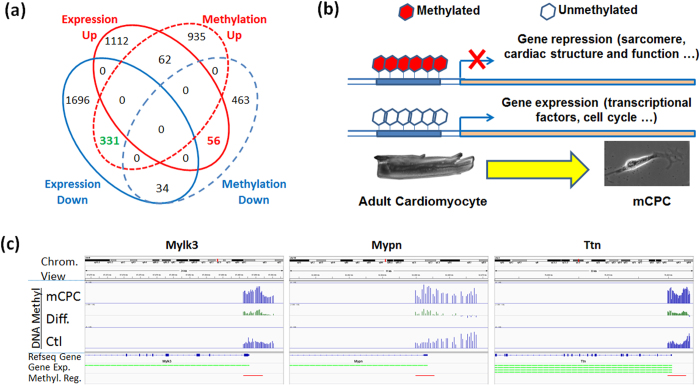
Figure 4. Epigenetic regulation of transcriptional changes in mCPC cells.
(a) Venn diagram of overlapping differentially-expressed genes (|Fold change| ≥ 1.5 plus P = 0.05, FDR-adjusted p ≤ 0.25; Affymetrix mouse GeneChip 430 2.0) and differentially-methylated genes (defined as p ≤ 0.05; combination of the CHARM analysis on the data from NimbleGen 3 × 720 k Promoter array and customer 2.1 M CHARM array). (b) Model depicting the epigenetic regulation in mCPCs derived from dedifferentiated cardiomyocytes. The promoters of adult and cardiac specific genes, and sarcomere structure genes become hypermethylated, resulting in their transcriptional repression in mCPCs, while transcriptional factors important to cell cycle/proliferation and progenitor stemness are not or less methylated, conferring their expression in mCPCs. (c) Visualization of the methylation in promoter regions of sarcomere genes myosin light chain kinase 3 (Mylk3), myopalladin (Mypn), and Titin (Ttn) detected by the NimbleGen 3 × 720 k DNA methylation promoter array. Top panel shows the chromosomal region flanking these genes. Middle panel: the middle bar graphs present the DNA methylation levels (1.0 = 100%) in mCPCs and control cardiomyocytes (Ctl), as well as the differential methylation level (Diff.) comparing mCPC to Ctl. The bottom portion shows the Refseq gene structure, the expression of transcript detected by probe(s) for which green color denotes down-regulation, and the differentially-methylated region in mCPCs vs. cardiomyocytes.

