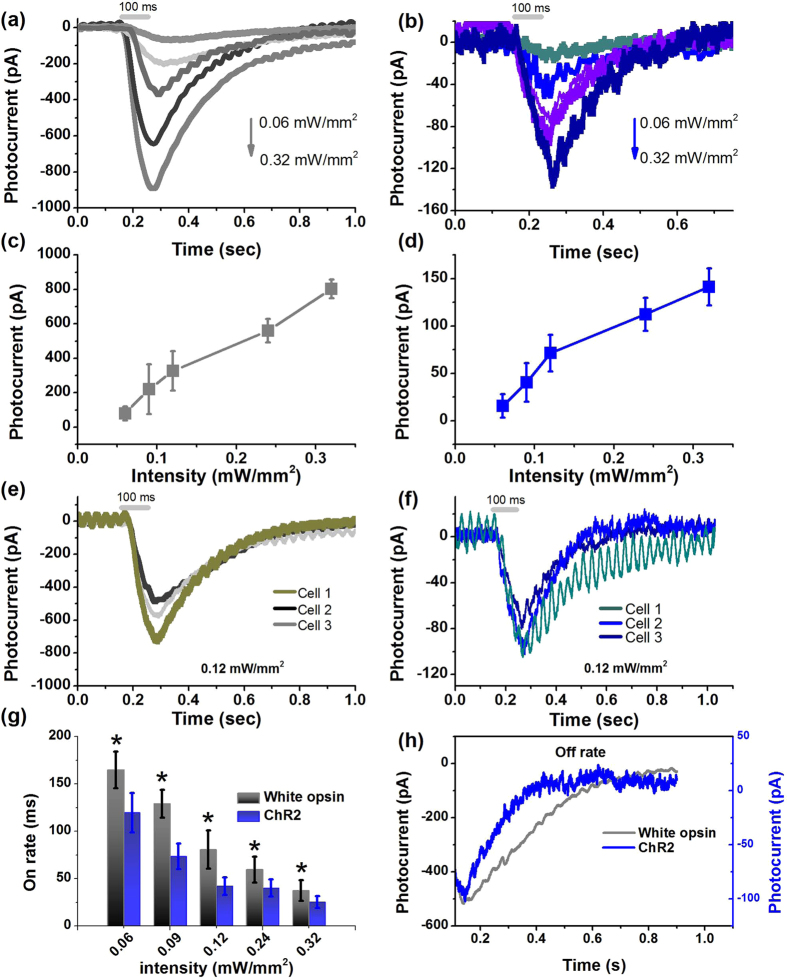
Figure 2. White-opsin expression leads to significantly higher photocurrent in response to white-light as compared to narrow-band ChR2-opsin.
(a) Representative inward current in a white-opsin expressing HEK293 cell upon white light illumination at five different intensities. (b) Representative inward current in a ChR2 expressing HEK293 cell upon white light illumination at the same five different intensities. (c) Variation of peak photocurrent in white-opsin expressing HEK293 cells as a function of intensity of white-light (pulse width: 100 ms). N = 8 cells, 26 sweeps. Average ± S.D. (d) Variation of peak photocurrent in ChR2 expressing HEK cells as a function of white-light intensity. N = 8 cells, 27 sweeps. Average ± S.D. (e) White-opsin expression-dependent inward photocurrent measured in three different representative cells for fixed white light intensity. (f) Measured inward photocurrent in three different representative cells expressing different levels of ChR2 for same fixed white light intensity. (g) Quantitative comparison of on-rate of white-opsin and ChR2 in response to white light at five different intensities. N = 6 cells/opsins. *p < 0.01 between white-opsin and ChR2 at five different intensities. (h) Comparison of representative inward photocurrent decay (for off-response) measured in white-opsin and ChR2 expressing cell stimulated by same white-light intensity.

