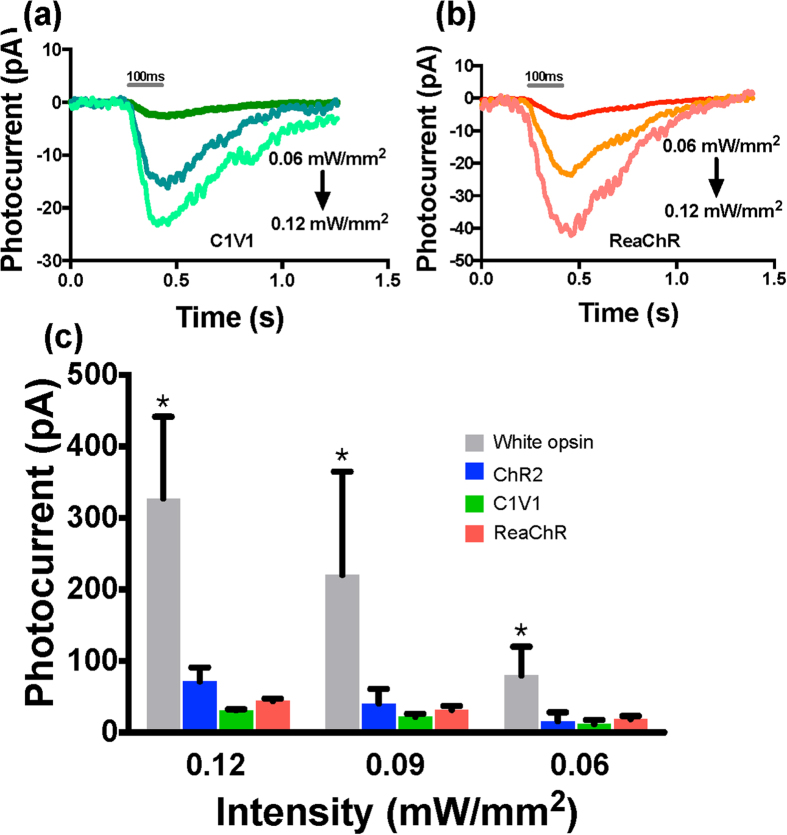
Figure 4. Quantitative comparison of photocurrent in cells expressing white-opsin versus ChR2, C1V1 or ReaChR in response to white-light stimulation.
(a) Representative inward current profiles in a C1V1 expressing HEK293 cell upon white light illumination at three different intensities (0.06, 0.09, 0.12 mW/mm2). (b) Representative inward current profiles in a ReaChR expressing HEK293 cell upon white light illumination at three different intensities. (c) Comparison of peak photocurrent in white-opsin (N = 8 cells, 26 sweeps) vs. ChR2 (N = 8 cells, 27 sweeps), C1V1 (N = 2 cells, 12 sweeps), or ReaChR (N = 2 cells, 12 sweeps) expressing HEK293 cells at three different intensities of white-light (pulse width: 100 ms). Average ± S.D. *p < 0.01 between white-opsin and others at three different intensities.

