Figure 4.
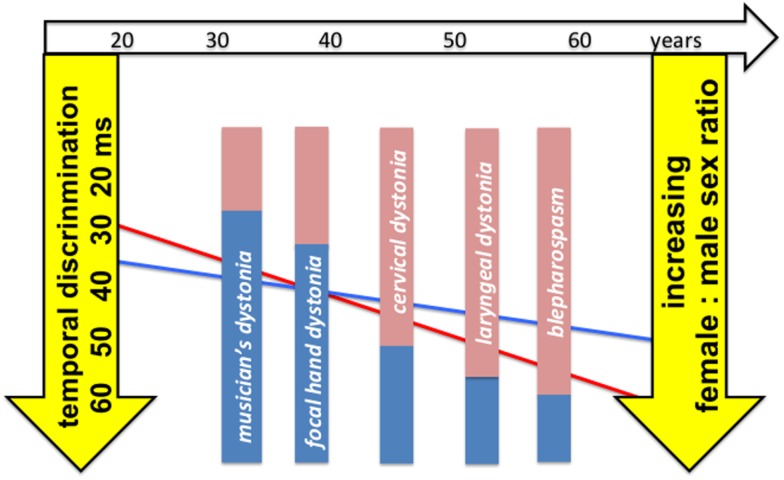
Graphic illustrating the relationship between age-related sexual dimorphism in temporal discrimination thresholds, mean age of onset and sex ratios in phenotypes of adult-onset isolated focal dystonia. Temporal discrimination (in milliseconds) is inverted on the left Y-axis so that worse discrimination is lower on the axis. The X-axis represents age in years (open arrow at the top of the figure). Each of the five phenotypes (musician’s dystonia, focal hand dystonia, cervical dystonia, laryngeal dystonia, and blepharospasm) are represented by filled bars, positioned at their mean age of onset, with the sex ratio for each phenotype illustrated by the colored inserts (pink for women: blue for men) (right Y-axis); the increasing female:male sex ratio with age is illustrated by the relative size of the filled bars. The regression lines (red for women; blue for men) from the analysis of the temporal discrimination thresholds (TDTs) in the unaffected first-degree relatives are drawn to illustrate the age-related sexual dimorphism of the TDT in relationship to the increasing female predominance with age of the phenotypes.

