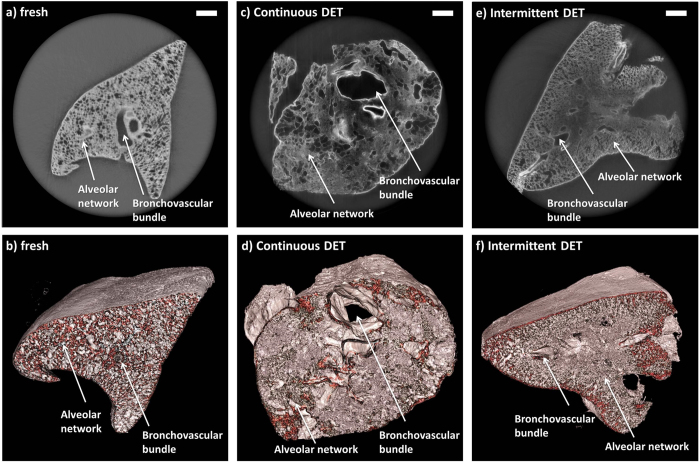
Figure 3. Images acquired with the synchrotron-based PC-CT showing a fresh rat lung (reconstructed with δ/β = 550) [(a,b)] and rat lung specimens that were decellularized via continuous DET (reconstructed with δ/β = 1000) [(c,d)] and intermittent DET (reconstructed with δ/β = 1000) [(e,f)].
The images show transverse cross sections through the samples [(a,c,e)], and three-dimensional views [(b,d,f)]. All scale bars represent 500 μm.

