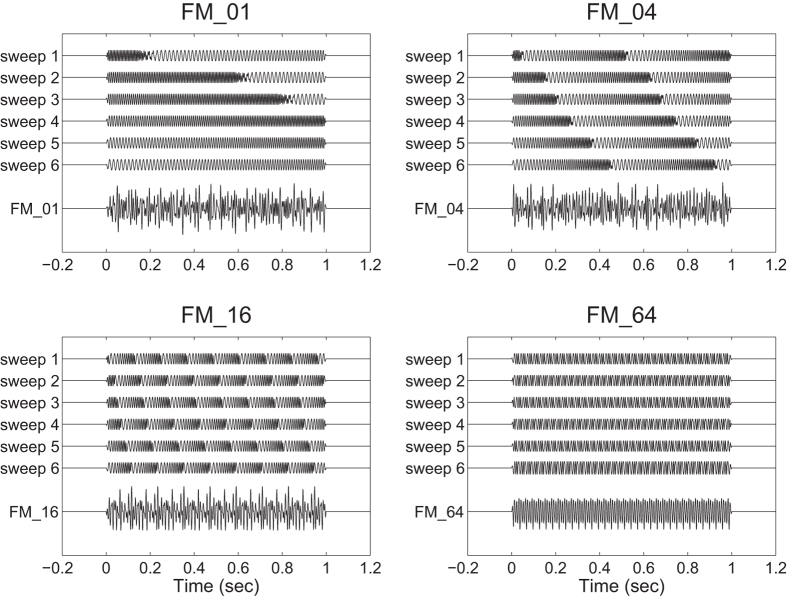
Figure 1. Schematic sound waveforms of test stimuli.
Each test stimulus consisted of six temporally repeating frequency-modulated (FM) sweeps between 500 and 2000 Hz. The initial frequencies of the test stimuli were randomly selected between 500 and 2000 Hz and then frequency-modulated upward at 1 (FM_01), 4 (FM_04), 16 (FM_16), and 64 (FM_64) octaves per sec. Exemplary sound files are available in Additional files S1, S2. S3, and S4.

