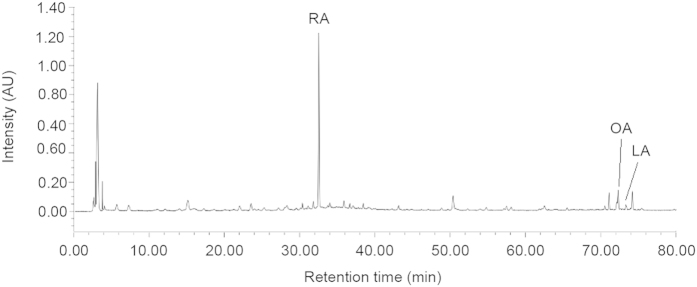
Figure 8. Chromatography analysis of P. frutescens extract (PFE).
The concentration of PFE for HPLC analysis was 4 mg/ml. The injection volume was 20 μl, and the UV detection wavelength was set at 210 nm. The HPLC fingerprint showed peaks of rosmarinic acid (RA), oleanolic acid (OA), and linoleic acid (LA) at 32.5, 72.1, and 73.4 min, respectively.

