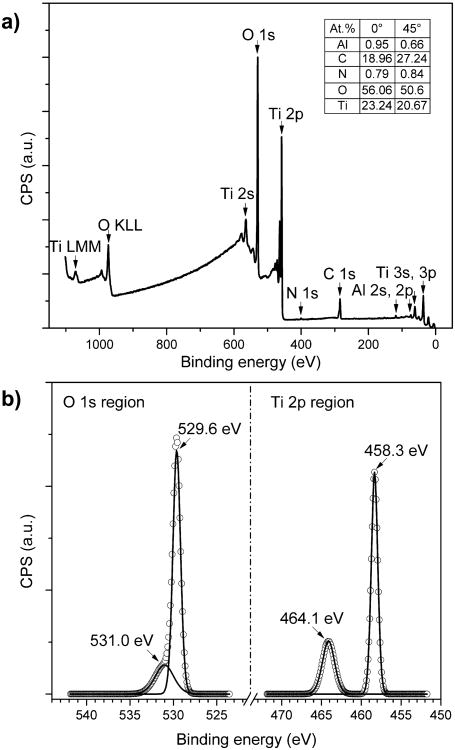
Figure 2.
XPS spectra of the prepared TiO2 thin-film: (a) Full spectrum survey scan collected at 0° to the surface normal. The inset shows the calculated surface compositions from XPS survey scans performed at both 0° and 45° to the surface normal. (b) High resolution scans of O 1s and Ti 2p regions with background signal removals. The solid lines represent the deconvoluted peaks from collected signals (denoted by open circles). The binding energy scales of all spectra are calibrated to the C 1s C*-C peak at 284.5 eV.

