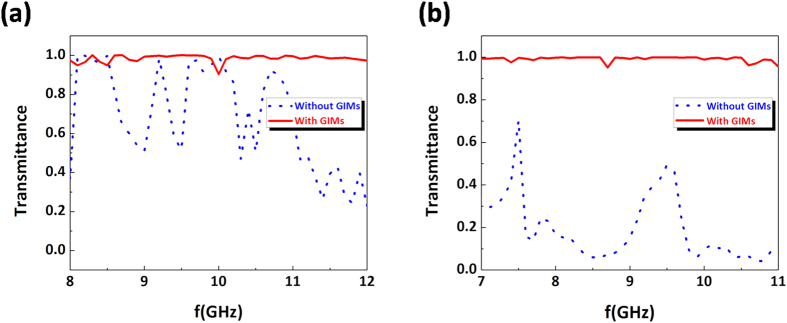
Figure 5. The transmittance vs frequencies for the case of the proposed bending waveguide in Fig. 3. (a,b) are the corresponding results for the incident wave with TE1 and TM0modes, respectively.
In plots, the red solid curve is the case of waveguide with GIMs, while for the blue dot curve, it is the case of waveguide without GIMs.

