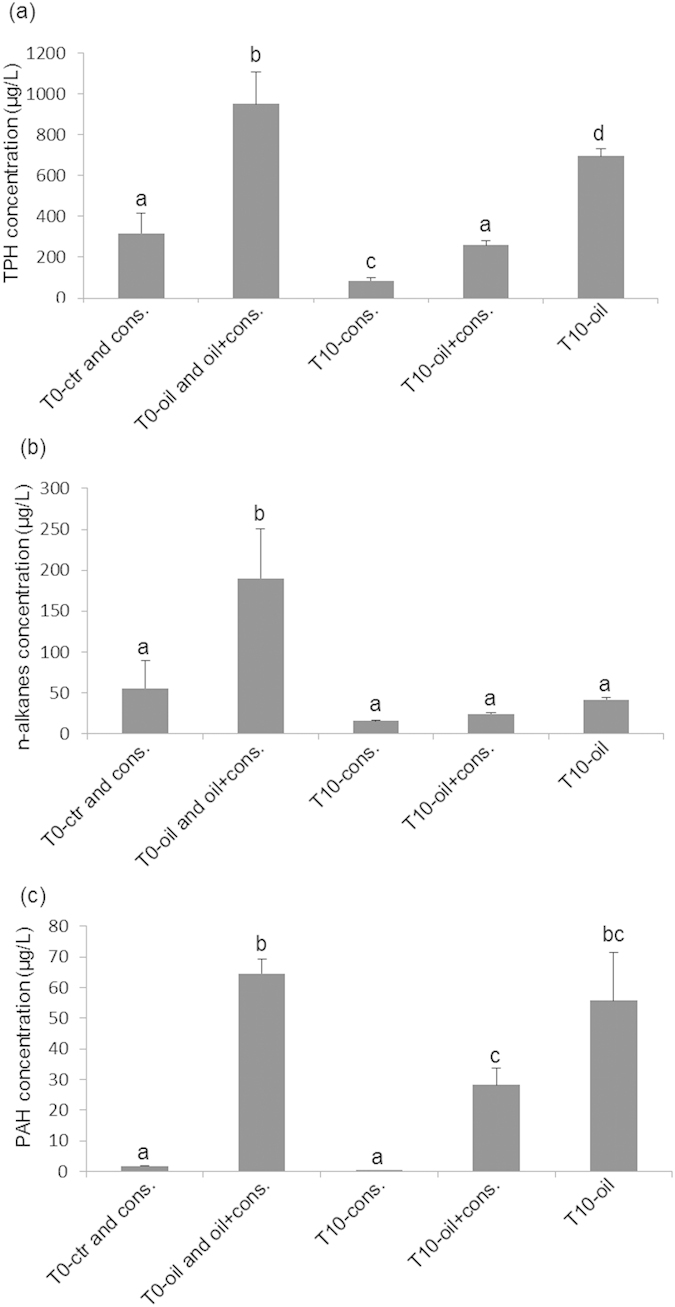
Figure 1. Concentrations of hydrocarbons during experimental sampling.

Concentration of total petroleum hydrocarbons (TPH) (a). concentration of n-alkanes hydrocarbons (b). concentration of polycyclic aromatic hydrocarbons (PAHs) (c). T0-ctr and cons. (treatments: control and consortium, time zero); T0-oil and oil+cons. (treatments: oil and oil+consortium, time zero); T10-consortium (consortium, day 10 of the experiment); T10-oil+consortium (oil+consortium, day 10 of the experiment); T10-oil (oil only, day 10 of the experiment).
