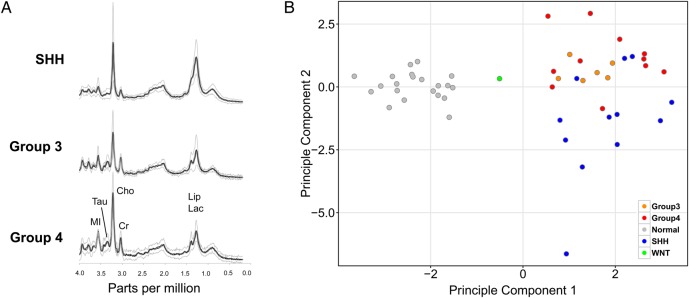
Fig. 1.
MR spectra patterns in medulloblastoma subgroups (A) Average and standard deviation of MR spectra of Group 4 (n = 11), Group 3 (n = 6), and SHH (n = 12) medulloblastomas scaled to the measured absolute concentrations to allow direct comparison. (B) Unsupervised principal component analysis of MRS metabolites (n = 14) demonstrating separation of medulloblastoma (n = 30) and normal cerebella (n = 21) samples (grey=normal cerebella, medulloblastomas; orange=Group 3; red=Group 4; blue=SHH; green=WNT).

