Fig. 5.
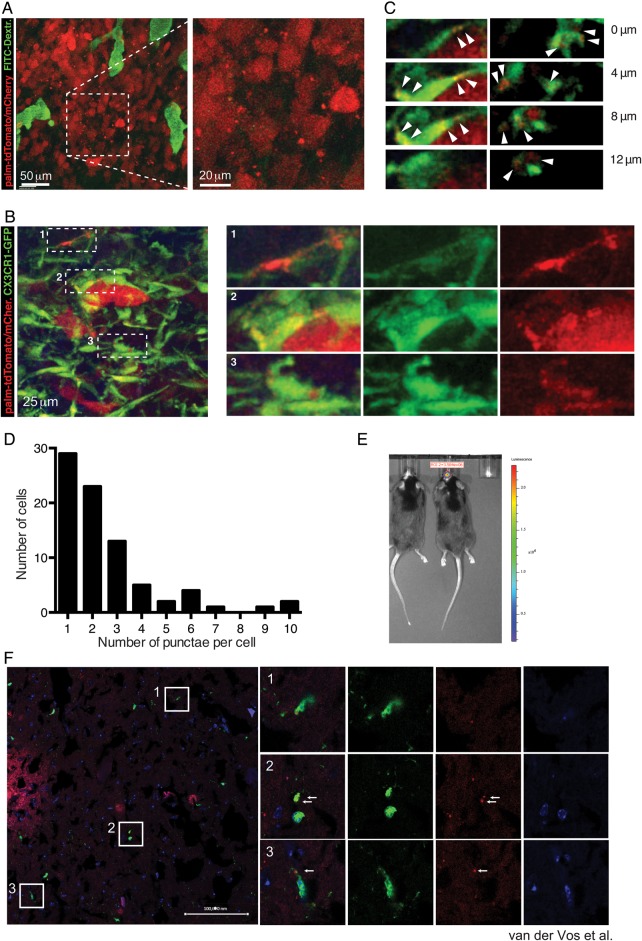
In vivo visualization of glioma-derived EVs and uptake by microglia/macrophages. (A) MP-IVM images from a GL261-Fluc-mC-palmtdT in a C57BL/6 mouse implanted with a brain window. Injected i.v. was 150 kDa fluorescein isothiocyanate–dextran to label the blood vasculature. (B) MP-IVM images from a GL261-Fluc-mC-palmtdT tumor in a CX3CR1GFP/+ mouse brain. Panels on the right show magnified subregions of panel on the left. (C) Individual sections highlighting intracellular localization of red punctae. (D) Frequency distribution of number of discernible red punctae per cell. (E) Tumor size of GL261-Fluc-mC-palmtdT cells implanted intracranially into CX3CR1+/GFP mice monitored by bioluminescence in vivo Fluc imaging. Cryosections were performed to visualize in vivo EV uptake. Released EV-like entities (palmtdT+) were readily observed around the tumor, as well as within GFP+ cells. Nuclei were visualized by DAPI. Arrows indicate red punctae within GFP+ cells. Bar = 100 000 nm.

