Fig. 5.

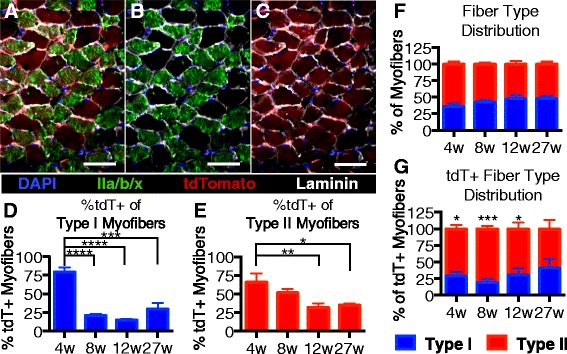
Differential contribution of satellite cells to fast and slow twitch myofibers. a–c Images shows soleus muscle sections from mice given tamoxifen injections at 27 weeks old and collected 2 weeks post injection. tdTomato-expressing myofibers are shown in red, and myofibers labeled with an antibody to identify fast twitch myofibers are shown in green. d Quantification of tdTomato expression in type I myofibers. e Quantification of tdTomato expression in type II myofibers. f Soleus fiber type distribution by age. g Fiber type distribution of tdTomato-expressing myofibers by age. Pseudocolored images display DAPI (blue), laminin (white), tdTomato (red), and fast myosin heavy chain (green, IIa, IIb, and IIx). Scale bars are 50 μm. *P < 0.05, ***P < 0.001. Mean ± standard error of the mean is plotted. Significance was determined by Student’s t test. Three biological replicates were analyzed per time point
