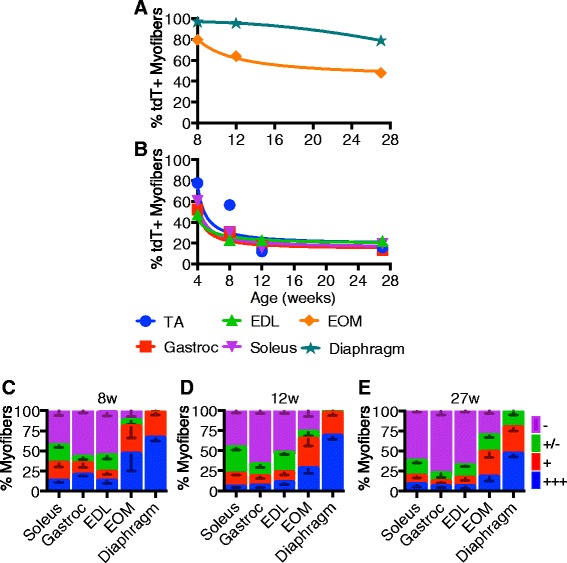
Fig. 7.

Satellite cell contribution to myofibers is age dependent and varies in different muscles. a–b Non-linear regression trend lines for percentages of tdTomato-expressing myofibers through experimental time points from the EOM and diaphragm (a) and EDL, soleus, and gastrocnemius (b). c–e Quantification of myofiber tdTomato-expression of hindlimb, EOM, and diaphragm muscles with recombination induced at 4 (c), 12 (d), or 27 weeks (e). Quantification of tdTomato was evaluated at four relative levels of expression: +++ very high tdTomato intensity (see example myofiber “1” in Fig. 3c, 12 weeks), + intermediate tdTomato intensity (see example myofiber “2” in Fig. 3c, 12 weeks), +/− very low tdTomato intensity myofibers and scored as negative (see example myofiber “3” in Fig. 3c, 12 weeks), and – fibers do tdTomato intensity indistinguishable from background (see example myofiber “4” in Fig. 3c, 12 weeks)
