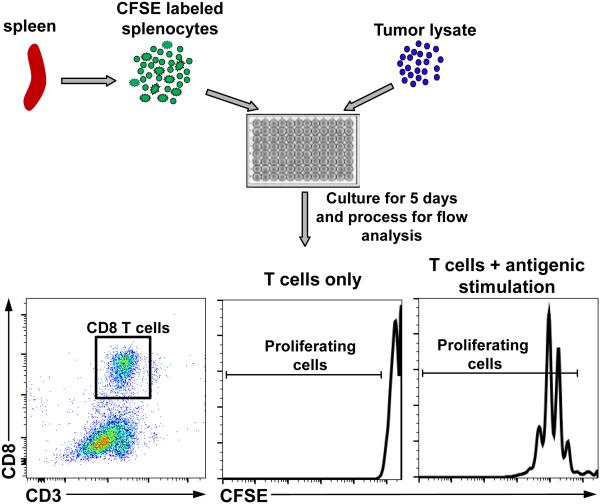
Figure 4. Workflow for T cell proliferation assay.
Purify splenocytes, remove RBCs, label with CFSE dye and culture with tumor lysate followed by processing for flow cytometric analysis. Dot plots show gating strategy for CD8 T cells. Histograms show representative images of CFSE stains in unstimulated and stimulated CD8 T cells.

