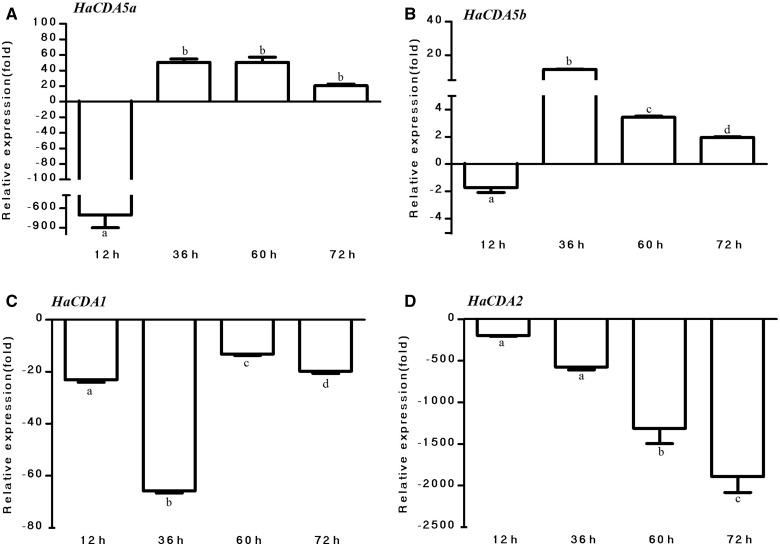
Fig. 6.
Expression of different CDAs in H. armigera larvae. Total RNAs were isolated from the larvae at different time post ingestion and then reverse-transcribed, and RT-qPCR was performed using specific primers and normalized relative to the transcription level of reference gene (β-actin). The data were given as means ± SE and were analyzed by analysis of variance followed by the Tukey–Kramer test, using SPSS 16.0 (SPSS) for MS Windows. Different letters on the columns meant significant difference (P < 0.05).

