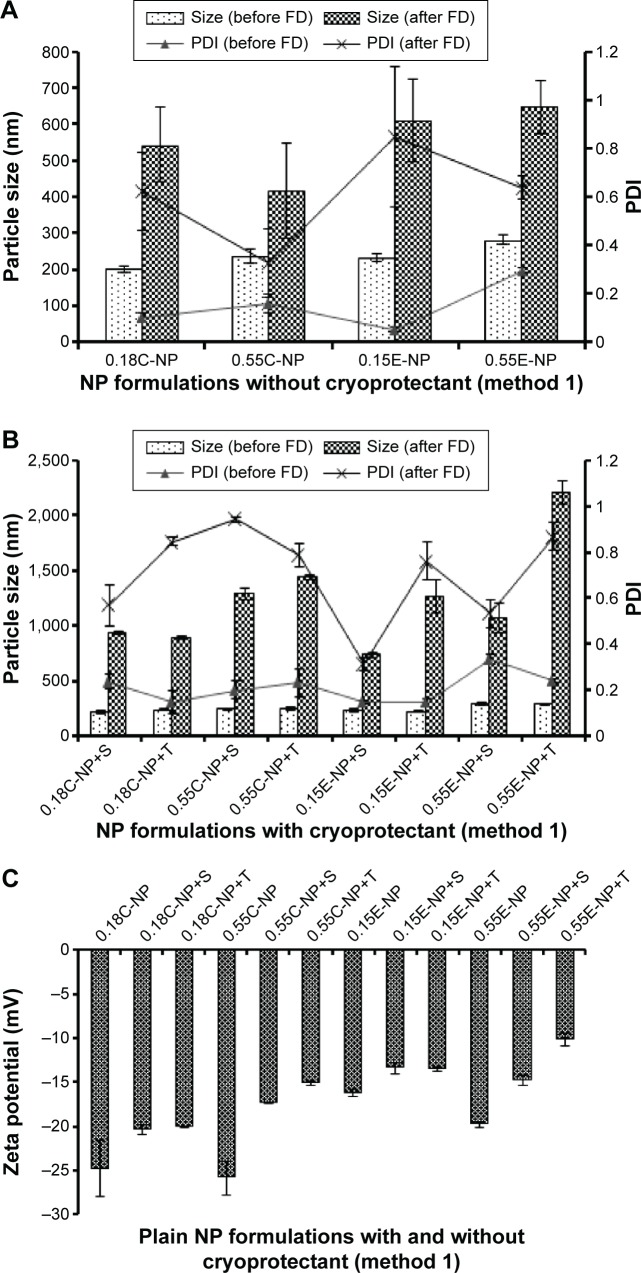
Figure 2.
Particle size, PDI, and ZP of NPs prepared with different PLGA polymer end groups and viscosities following method 1.
Notes: The bar diagram and line plots represent particle size and PDI value, respectively. (A) Represents the NP formulations prepared without cryoprotectant. (B) Represents the same formulations preserved with two different cryoprotectants namely sucrose and trehalose. (C) Represents the comparative ZP of all NP formulations with or without cryoprotectant. The level of significance was set to P<0.05 (one-way ANOVA followed by Tukey’s multiple comparison test method). Each bar and line represents mean ± SD (n=12). C = COOH ended PLGA; E = ester ended PLGA, S = sucrose (10%); T = trehalose (10%).
Abbreviations: PDI, polydispersity index; ZP, zeta potential; NP, nanoparticle; PLGA, poly(d, l-lactide co-glycolide); ANOVA, analysis of variance; SD, standard deviation; COOH, carboxylic acid; FD, freeze-drying.

