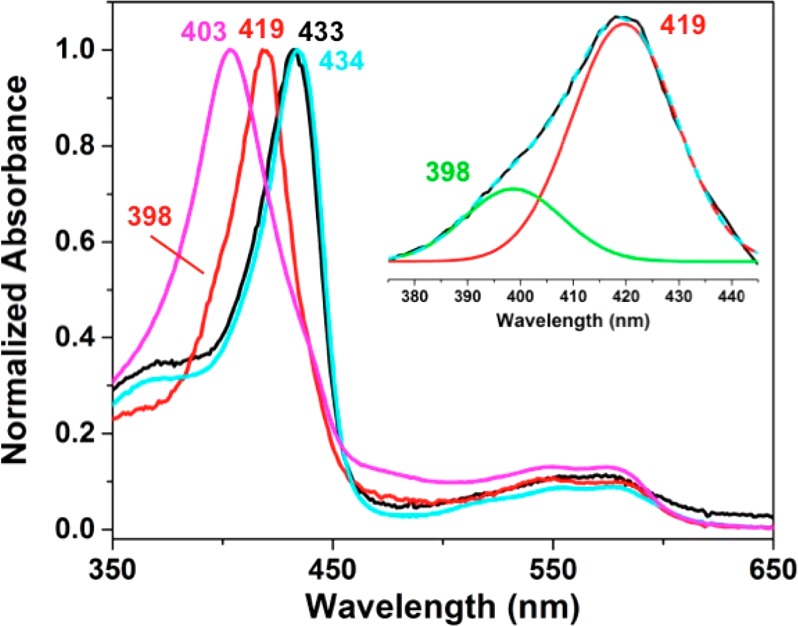
Figure 3.

UV–vis spectra of FeII-FeBMb1(57FeII) (black curve), ZnII-FeBMb1(57FeII) (cyan curve), and the corresponding mononitrosyl derivatives FeII-FeBMb1(57FeIINO) (red curve) and ZnII-FeBMb1(57FeIINO) (purple curve). The inset shows deconvolution of the Soret region of FeII-FeBMb1(57FeIINO) demonstrating two components: one peak at 419 nm corresponding to the 6cLS {FeNO}7 species and a second broader peak at 398 nm corresponding to the 5cLS {FeNO}7 species. The presence of both 6cLS and 5cLS {FeNO}7 species is consistent with the NRVS results (vide infra). In the case of the ZnII-FeBMb1(57FeIINO) sample, the presence of the Soret peak at 403 nm is also consistent with the presence of 5cLS {FeNO}7 also observed by NRVS (vide infra).
