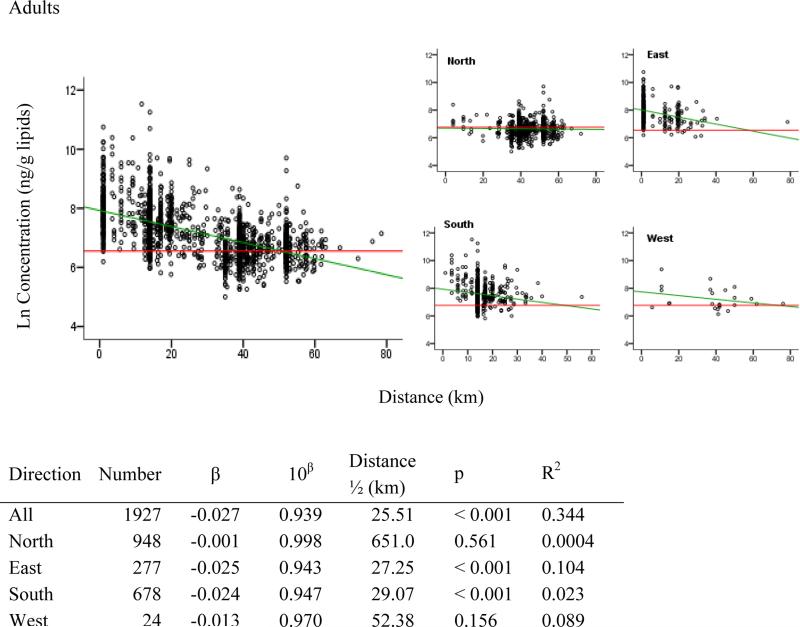
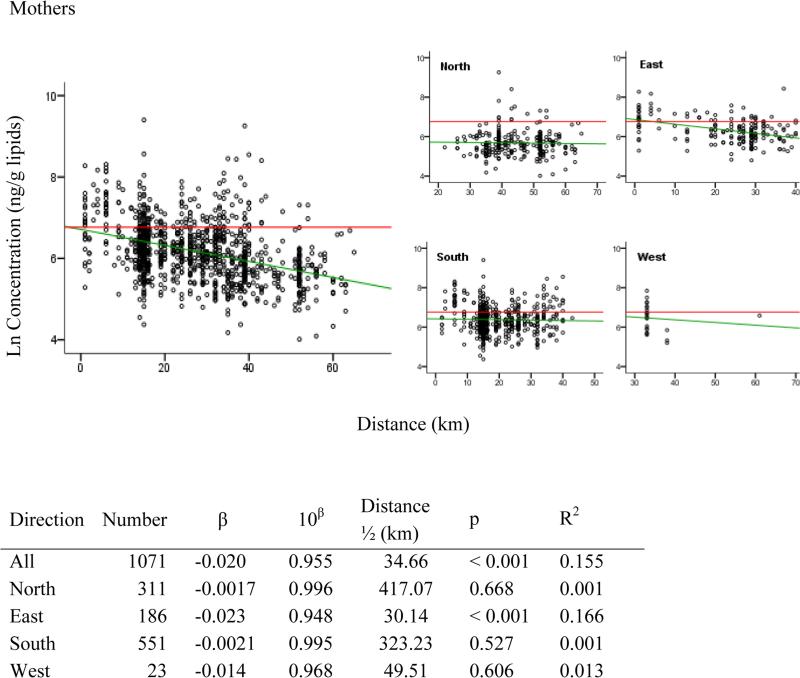
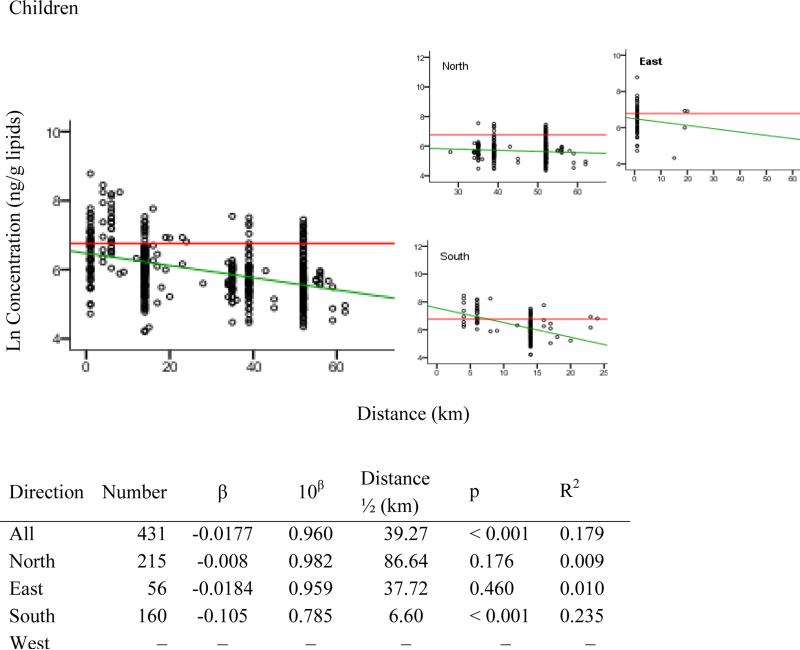
Fig. 2.
Relationship between lnΣPCBs serum concentration of PCBRISK adults, PCBRISK children and NIH project mothers and distance from the pollution source in km. The parameters of the lines of best fit (green) are shown in the adjacent table. The red horizontal line is the critical concentration suggested by ANSES (more see in text).


