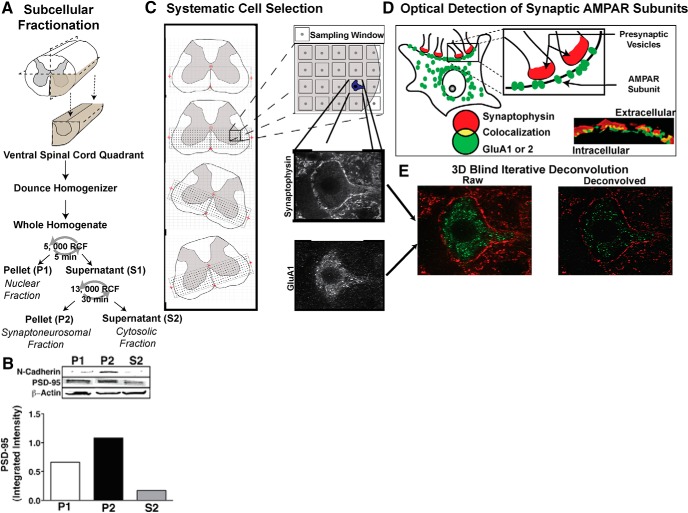
Figure 1.
Subcellular fractionation of ventral lumbar spinal cord. A, Ventral quadrant of lumbar spinal cord tissue was dissected and homogenized using a Dounce homogenizer. The whole homogenate was then centrifuged for 5 min at 5000 rcf, and the supernatant (S1) was removed. This S1 fraction was then centrifuged for 30 min at 13,000 rcf. The pellet from this fraction (P2) was then used for all subsequent Western blots. B, Plasma membrane enrichment in the P2 fraction was confirmed with N-cadherin expression, and modest synaptic enrichment (synaptoneurosome) was characterized by PSD-95, with beta-actin serving as loading control. C, Tissue-oriented coordinate grid placement for systematic cell selection. Large ventral horn neurons were systematically selected from spinal cord slices in L4–L5 region. A microscopist blind to experimental condition entered the stage coordinate location of four anatomical landmarks (central canal, anterior artery, left edge of tissue, right edge of tissue) into an Excel spreadsheet, and a custom VisualBasic macro generated a list of microscope stage coordinates that were then input into MicroManager and ImageJ software that controlled microscope stage movement. This system ensured that the orientation of the coordinate grid would always be relative to the specific orientation of the tissue. Each coordinate signified the center of an 80 × 80μm sampling window, with each coordinate spaced 100 μm apart. The blind microscopist cycled through these sampling windows at 63×. When a large neuron (cell body >40 μm) was encountered within a sampling window, the cell was centered in the frame and a stack of images was taken through the z-plane, with separate images taken through a 650 nm filter (for synaptophysin) and a 490 nm filter (for GluA1 or GluA2) at each level. D, Optical detection of synaptic AMPAR subunits. Yellow pixels produced by the overlapping of the presynaptic marker synaptophysin (red) and postsynaptic AMPAR subunit (green) puncta indicated colocalization and were quantified to determine the amount of synaptic AMPAR subunit expression. E, All image stacks were combined and deconvolved to correct for the diffusion of light using AutoQuant software.

