Figure 2.
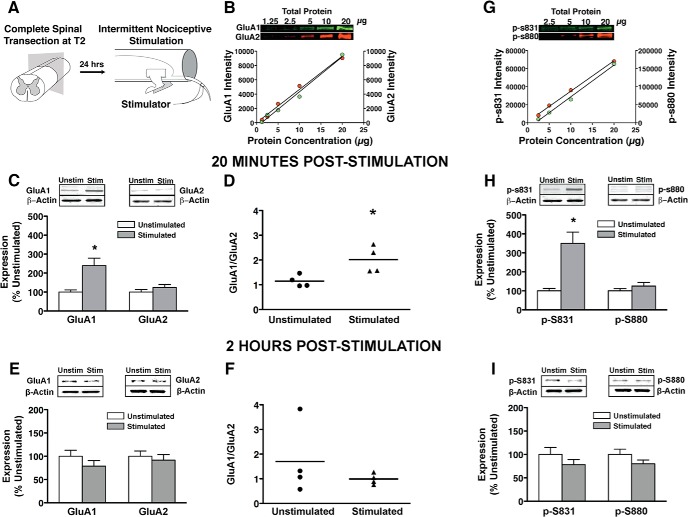
Plasma membrane GluA1 and GluA2 phosphorylation with intermittent nociceptive stimulation delivered below complete spinal cord injury. A, Intermittent nociceptive stimulation. Rats with complete spinal transections received 6 min of intermittent nociceptive stimulation to the tail. Unstimulated controls received an equivalent period of restraint. B, Quantitative fluorescent intensity optimized for linear detection of each target band using a 1:2 dilution curve of total protein. Laser scanning intensity for each target protein was chosen based on closest linear relationship between fluorescent intensity and total protein (all R 2 > 0.98). All subsequent analyses for each target protein were run at their respective optimal scanning intensities to ensure linearity of fluorescence (see Materials and Methods for details). C, Linear quantification of GluA1 and GluA2 AMPAR subunits, 20 min poststimulation. Stimulation significantly increased GluA1 expression compared to unstimulated controls (*p < 0.05), whereas GluA2 expression was unchanged. D, The ratio of GluA1 to GluA2 subunit expression was significantly increased in stimulated animals within 20 min (Mann–Whitney U; *p < 0.05). E, F, Linear quantification of GluA1 and GluA2 AMPAR subunits, 2 h poststimulation. Stimulation had no significant effect on GluA1 or GluA2 after 2 h (p > 0.05). G, Linear intensity optimization on phosphorylated serines 831 and 880. H, Linear quantification of p-S831 and p-S880 protein expression 20 min poststimulation. Stimulation significantly increased phosphorylated serine 831 expression relative to unstimulated controls (*p < 0.05), whereas phosphorylated serine 880 was unchanged. I, Stimulation had no significant effect on p-S831 or pS880 after 2 h (p > 0.05). All bars represent mean for n = 4 subjects/per group (n = 8 for main effects, n =4 for interaction) with three independent Western blot runs per subject. Error bars represent standard error of the mean.

