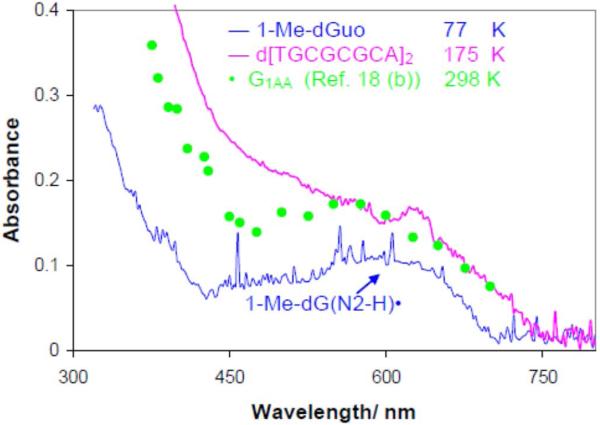
Figure 6.
The UV-visible absorption spectra of one-electron oxidized guanine in oligos and model compounds. The pink line is that of one-electron oxidized d[TGCGCGCA]2 in glassy (7.5 M LiCl) in H2O at pH 9 at 180K and is assigned to G(N2-H)•:C. The ESR spectrum is shown in Figure 5A. In blue the UV-vis spectrum of an authentic G(N2-H)• from 1-Me-Guo (blue) at 77 K in 7.5 M LiCl glass/H2O at pH 9 whose ESR spectrum is also shown in Figure 5A. The green data points are taken from existing pulse radiolysis spectrum of one-electron oxidized guanine containing oligo (sequence G1AA, see Figure 4 in Ref. 18b) in aqueous solution at ambient temperature. The spectra in the pink, green, and the blue spectrum have been multiplied by 2.5, 4, and 0.5 respectively. The spikes in the blue UV-vis spectra are due to bubbles from liquid nitrogen.

