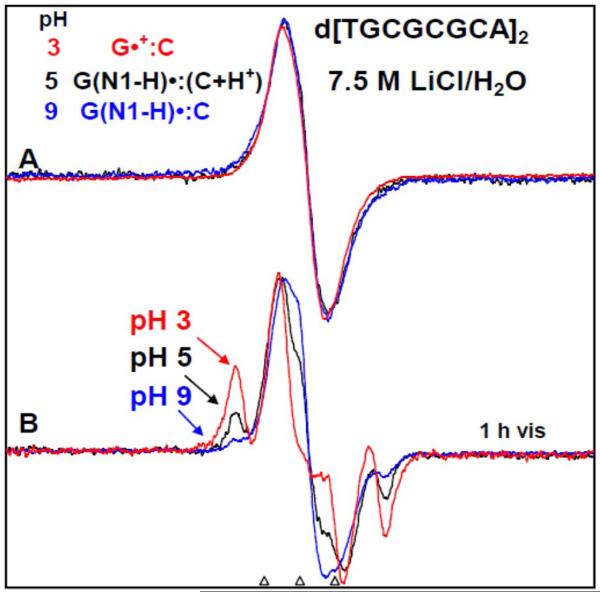
Figure 7.
(A) ESR spectra of one-electron oxidized d[TGCGCGCA]2 in 7.5 M LiCl/H2O in the presence of K2S2O8 as an electron scavenger at three pHs - at pH ca. 3 (red), ca. 5 (black), and at ca. 9 (blue). After 1h of photo-excitation by a 250 W photoflood lamp at 148 K, sugar radical formation indicated by the arrows is shown in Figure (B). The outer components are due to the C1′-radical. The extent of sugar radical formation via photo-excitation of one-electron oxidized d[TGCGCGCA]2 at pH ca. 3 is found to be higher by a factor of 7.5, and at pH ca. 5 is found to be higher by a factor of 3 than the corresponding extent of sugar radical formation at pH ca. 9. On this basis, spectrum at pH ca. 3 (red) is assigned to the cation radical G•+ in the ds DNA-oligomer, spectrum at pH ca. 5 (black) in (A) to G(N1-H)•:C(+H+) whereas the spectrum at pH ca. 9 (red) in (A) is assigned to G(N1-H)•:C. All spectra were recorded at 77 K.

