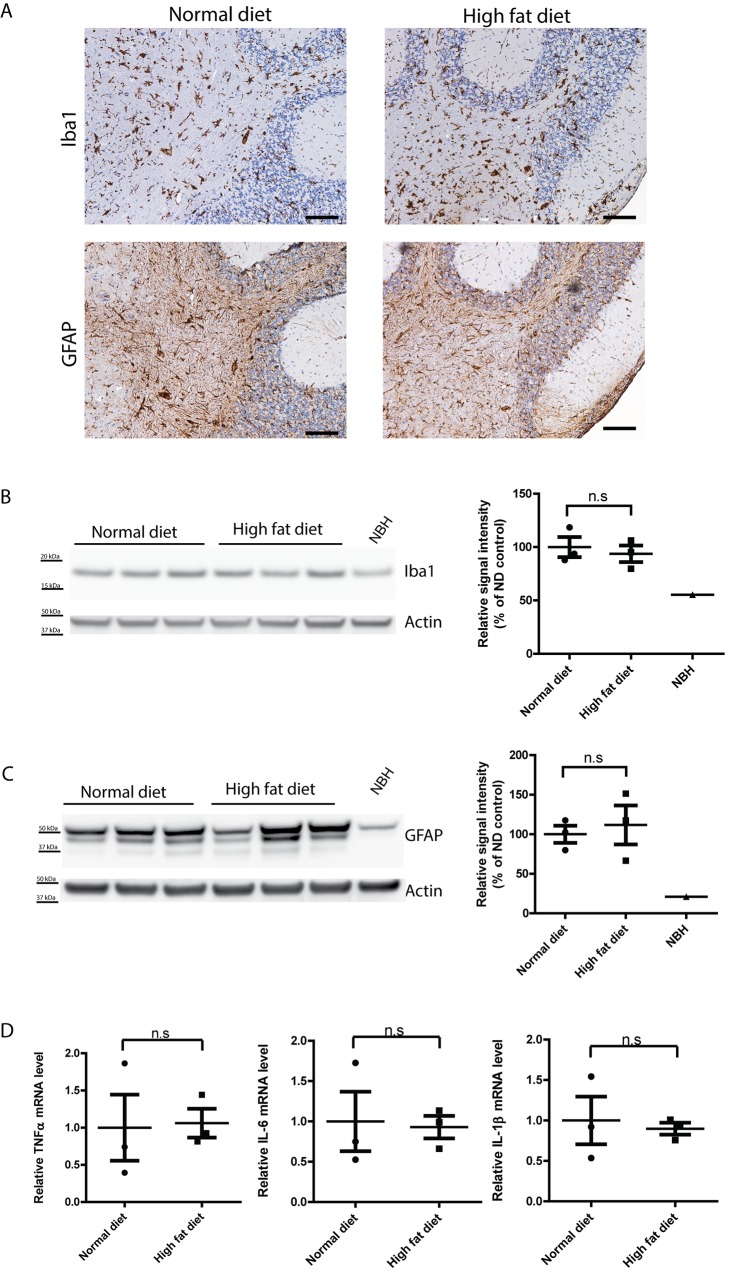
Fig 4. Similar level of astrogliosis and microglial activation in terminally sick HFD- and ND-fed tga20 mice.
(A) Representative immunohistochemical staining for GFAP and Iba1 in brains of terminally sick HFD-fed and ND-fed tga20 mice. There was no detectable difference between the two groups in astrogliosis or microglial activation. Scale bar = 100μm. (B) Left: Western blot for Iba1 in terminally sick mouse brains. Right: densitometric quantification of the Western blot revealed no significant difference of Iba1 levels between HFD-fed and ND-fed tga20 mouse brains (n = 3; n.s.: p>0.05). (C) Left: Western blot for GFAP in terminally sick mouse brains. Right: densitometric quantification of the Western blot showed no significant difference of GFAP levels between HFD-fed and ND-fed tga20 mouse brains (n = 3; n.s.: p>0.05). (D) qRT-PCR of cytokines TNFα, IL-6 and IL-1β expression revealed similar expression levels of these cytokines in terminally sick HFD-fed and ND-fed mouse brains (n = 3; n.s.: p>0.05).

