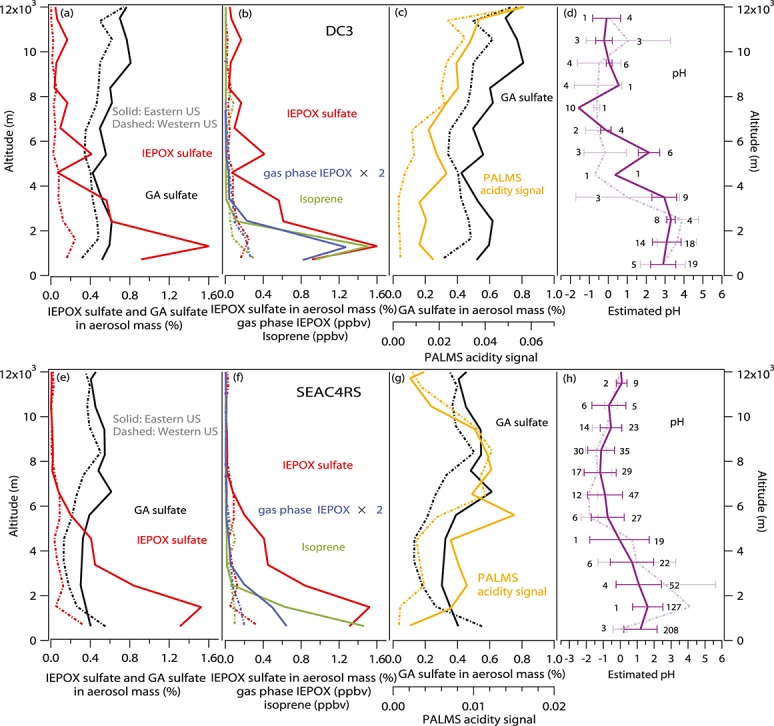
Figure 3.

Average vertical profiles of measured (a) IEPOX sulfate (red) and GA sulfate (black) in aerosol mass (%), (b) isoprene (green), gas phase IEPOX (blue), (c) and PALMS acidity signal (orange), and (d) estimated pH (purple) in the eastern (solid) and western (dashed) U.S. during DC3 and (e–h) SEAC4RS. Longitude 96°W is used to separate eastern U.S. data from western U.S. data. The error bars in the estimated pH panels represent ±1 standard deviation of the 5 min average data. The data points in each bin for eastern and western U.S. are on the right and left of the error bars, respectively.
