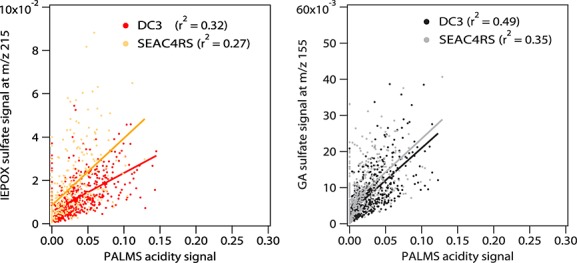
Figure 6.

(a) Scatterplots of PALMS IEPOX sulfate relative signal at m/z 215 versus PALMS acidity signal at low altitudes (<1000 m) in the eastern U.S. during DC3 (red) and SEAC4RS (orange). (b) The scatterplot of PALMS GA sulfate relative signal at m/z 155 versus PALMS acidity signal at low altitudes (<1000 m) in the eastern U.S. during DC3 (black) and SEAC4RS (gray). Each point represents one single particle.
