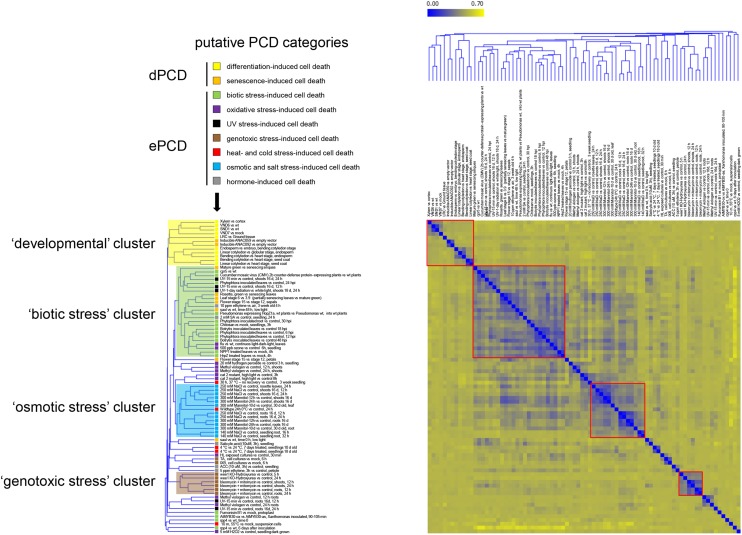
Figure 1.
PCD-associated ATH1 transcriptome data sets group in distinct clusters. HCA showing the clustering of 82 putative dPCD and ePCD conditions based on the log-fold expression values of differentially regulated genes and indicating their affiliation to different putative PCD categories (arrow). Four clusters are highlighted indicating the relatedness of data sets falling in the developmental, the biotic stress, the osmotic stress, and the genotoxic stress clusters. The color coding from blue to yellow indicates an increase in the Pearson’s correlation distance.

