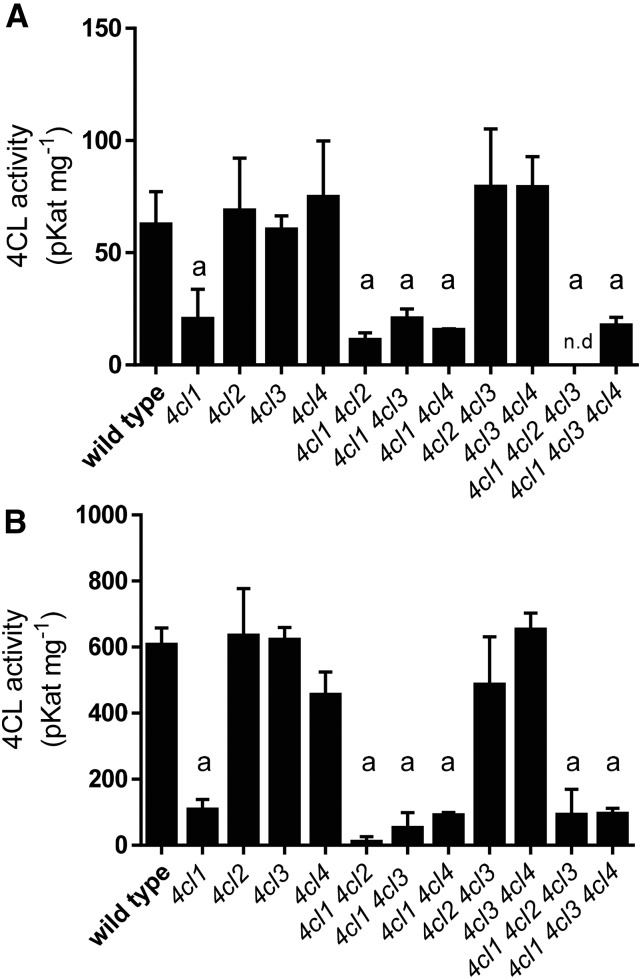
Figure 4.
4CL enzyme activity measuring product formation. A, Two-week-old rosette. B, Five-week-old inflorescence. n.d., Not detected. Error bars represent the sd of the means of three biological replicates. Using GraphPad Prism, the means were compared by one-way ANOVA (fixed model), and statistically significant differences (P < 0.05) were identified by Dunnett’s test and are indicated by the letter a.

