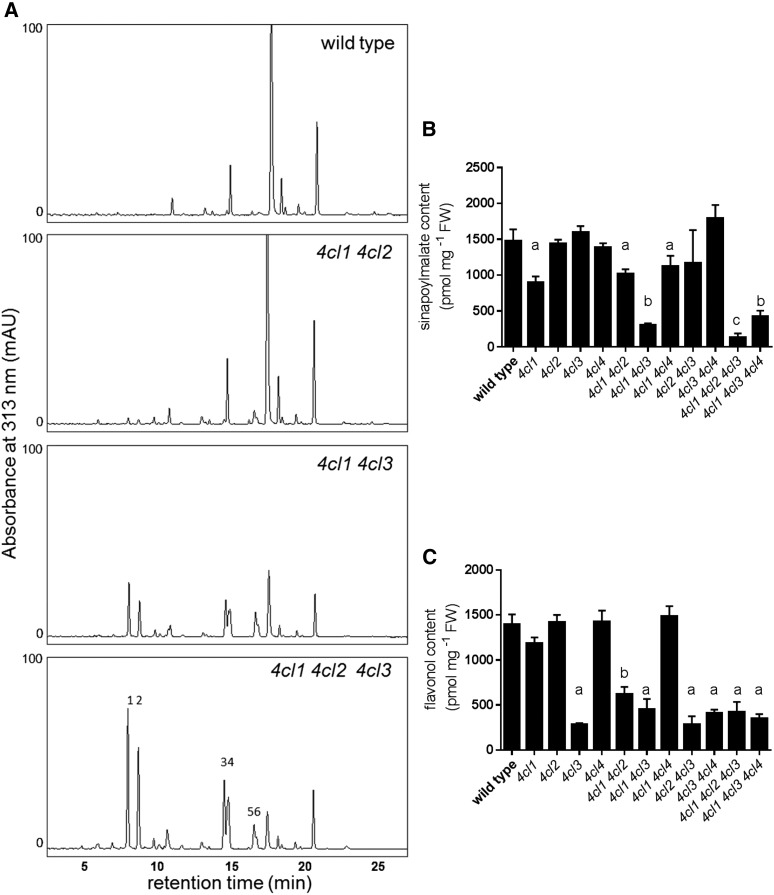
Figure 6.
Measurements of soluble metabolites in 2-week-old rosettes. A, HPLC chromatograms of rosette methanol extracts with UV absorbance measured at 313 nm. 1,2: p-coumaroyl Glc; 3,4: p-coumaroylmalate; 5,6: feruloylmalate. B, Sinapoylmalate content quantification by HPLC. C, Flavonol content quantification by HPLC. Error bars represent the sd of the means of at least three biological replicates. Using GraphPad Prism, the means were compared by one-way ANOVA (fixed model), and statistically significant differences (P < 0.05) were identified by Dunnett’s test and are indicated by a to c.

