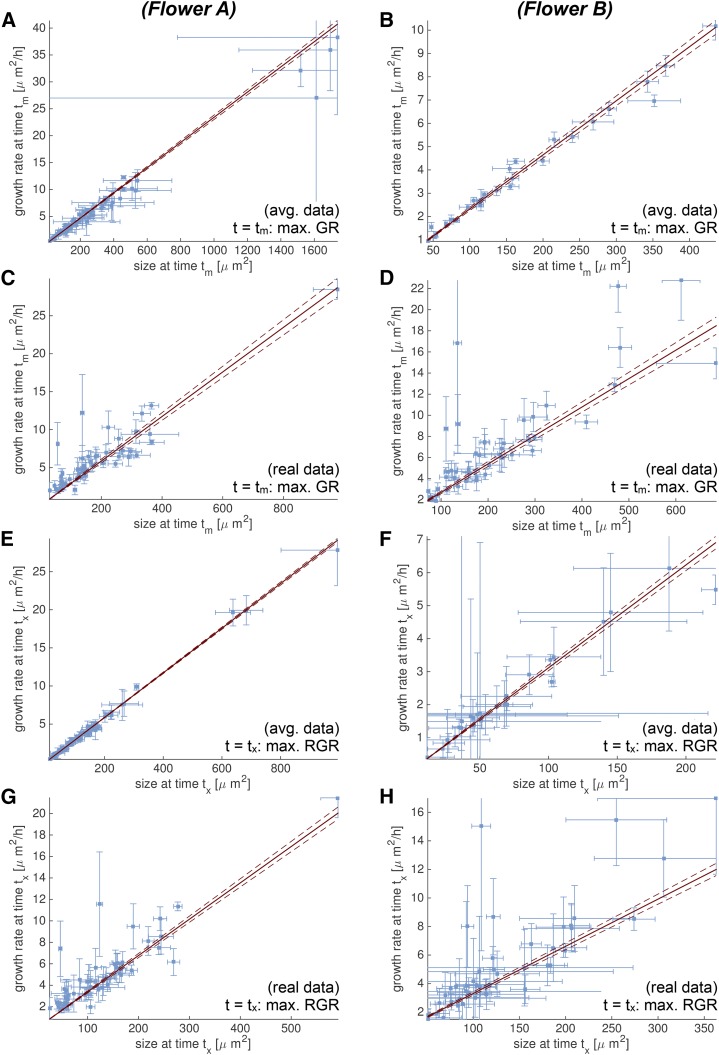
Figure 11.
GR and size are linearly correlated at times tm and tx. We analyze growth curves for flowers A (A, C, E, and G) and B (B, D, F, and H) using both the spatially averaged (A and B, E and F) and the real (C and D, G and H) data. We consider the time point tm (A–D) when the GR is maximal, and the time point tx (E–H) when the RGR(t) = GR(t) / area(t) is maximal. In all cases, we observe a linear correlation between GR and size, which suggests that RGR(tm) is the same for all cell lineages in the sepal. Likewise, this suggests that RGR(tx) is the same for all cell lineages in the sepal (see Fig. 12). Both the GR [GR(tm) and GR(tx)] and the size [area(tm) and area(tx)] are estimated from the fit of the data to an S curve. We only consider data with a meaningful fit. The uncertainty from the fit is propagated into an Sd for GR and area, which is shown in the plots as error bars. We fit constants for RGR(tm) and RGR(tx) and show them as red lines, with 95% confidence bounds as dotted lines.

