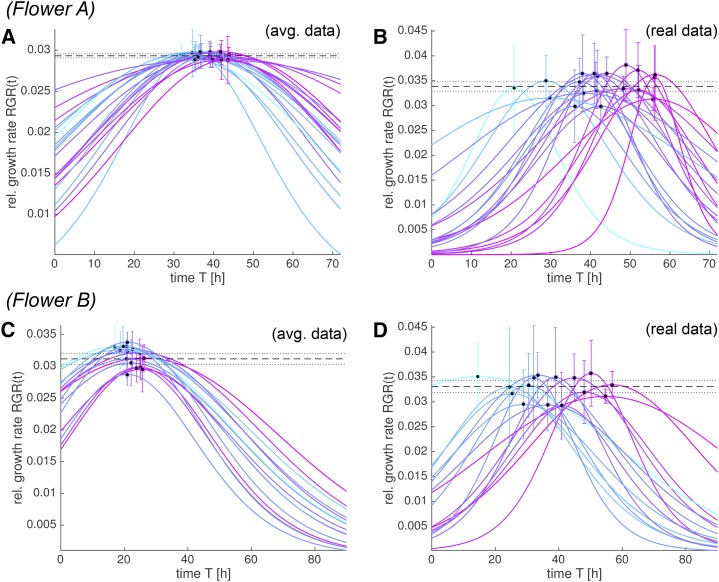
Figure 12.
Cell lineages reach the same maximal RGR. We show the RGR(t) for flowers A (A and B) and B (C and D) obtained from the best-fitting S curve for the spatially averaged (A and C) and the real (B and D) data. The maximum RGR for each lineage is marked with a dot at RGR(tx). The uncertainty from the fit is propagated into an sd for RGR(tx), which is shown in the plots as error bars. Note that all cell lineages reach the same maximum RGR, although the time tx, at which a cell reaches its maximum RGR, varies between cell lineages. The constant value for the maximum RGR(tx) (Table I; Fig. 11, C, D, G, and H) is displayed as a dashed black line with its 95% confidence bounds as dotted lines. We only consider data with a meaningful fit. The curves are colored according to tx (early [cyan] to late [purple]).

