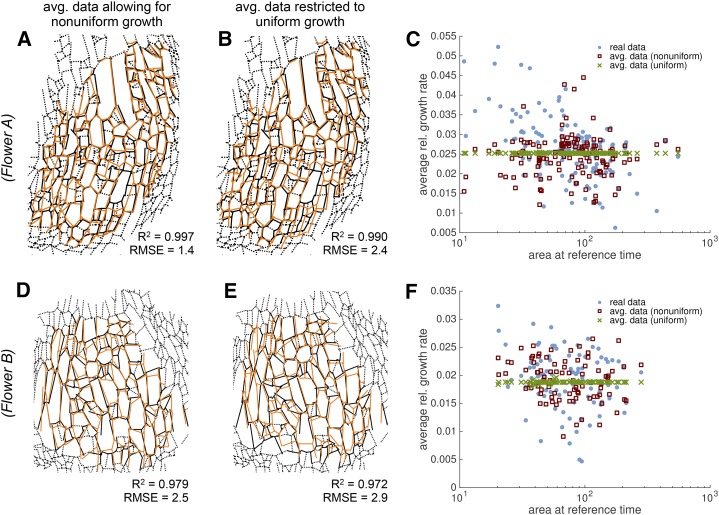
Figure 7.
Uniform growth in space predicts cellular growth. Comparison of various growth prediction methods (orange lines) with the real imaging data (black lines). A and D, The continuous low-order displacement field prediction (orange lines) for flowers A (A) and B (D) best match the data (black lines). These images replicate Fig. 5, C and F. B and E, Predictions (orange lines) from a displacement field with the additional constraint to have uniform growth in space (but not time), such that the relative increase in cell area is uniform, also matches well with the real data (black lines). It matches almost as well as the unconstrained displacement field (R2 and RMSE). For the real imaging data, we show additional walls, which did not exist in the reference time point or were not considered there (black dashed lines). C and F, Graph of the average RGR relative to the cell area at the reference time shows that the real data (blue dots) and the spatially averaged data (red squares) vary greatly around the uniform RGR (green crosses) used in the prediction for flowers A (C) and B (F).

