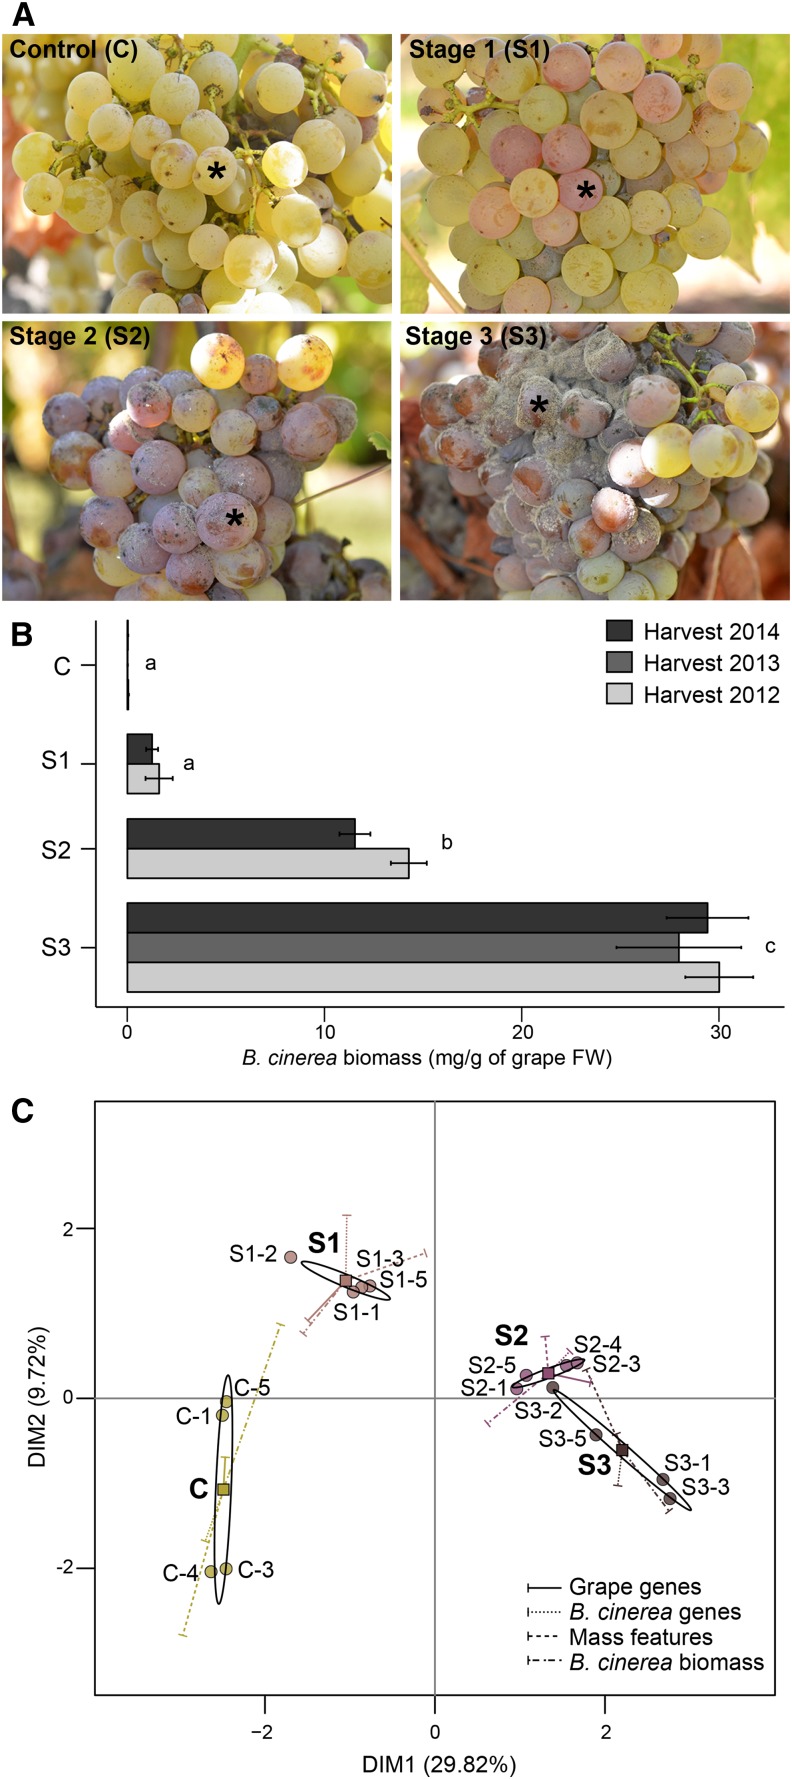
Figure 1.
Stages of noble rot in ripe cv Sémillon berries. A, Representative grape clusters with asymptomatic berries (control [C]) and berries at stages 1 (S1), 2 (S2), and 3 (S3) of noble rot. Asterisks indicate berries with characteristic phenotype of each noble rot stage. B, Accumulation of B. cinerea biomass in control and noble-rotted berries from three independent harvests. The harvest of 2013 includes control and stage 3 berries only. Letters correspond to significant differences between stages (P ≤ 0.01). FW, Fresh weight. C, MFA of infected and control berries using four types of quantitative variables (represented by vectors): transcript abundance of 24,373 grape genes and 15,550 B. cinerea genes, accumulation of 2,084 mass features, and B. cinerea biomass measurements. Samples used in this analysis were harvested in 2012. Each point represents a biological replicate for a given stage of noble rot. Ellipses define confidence areas (95%) for each stage, while squares represent their corresponding centers of gravity. DIM, Dimension.

