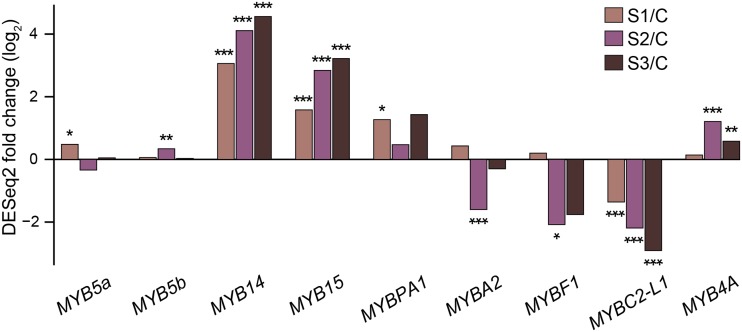
Figure 6.
Noble rot induction of transcription factors that control the phenylpropanoid metabolism. The bar plot depicts the expression fold changes (log2) of MYB transcription factors between each of the three stages of noble rot (S1, stage 1; S2, stage 2; and S3, stage 3) and the asymptomatic control (C). VvMYBC2-L1 and VvMYB4a are known to encode repressors of phenylpropanoid pathways. Asterisks indicate significant fold changes (*, adjusted P ≤ 0.05; **, adjusted P ≤ 0.01; and ***, adjusted P ≤ 0.001).

