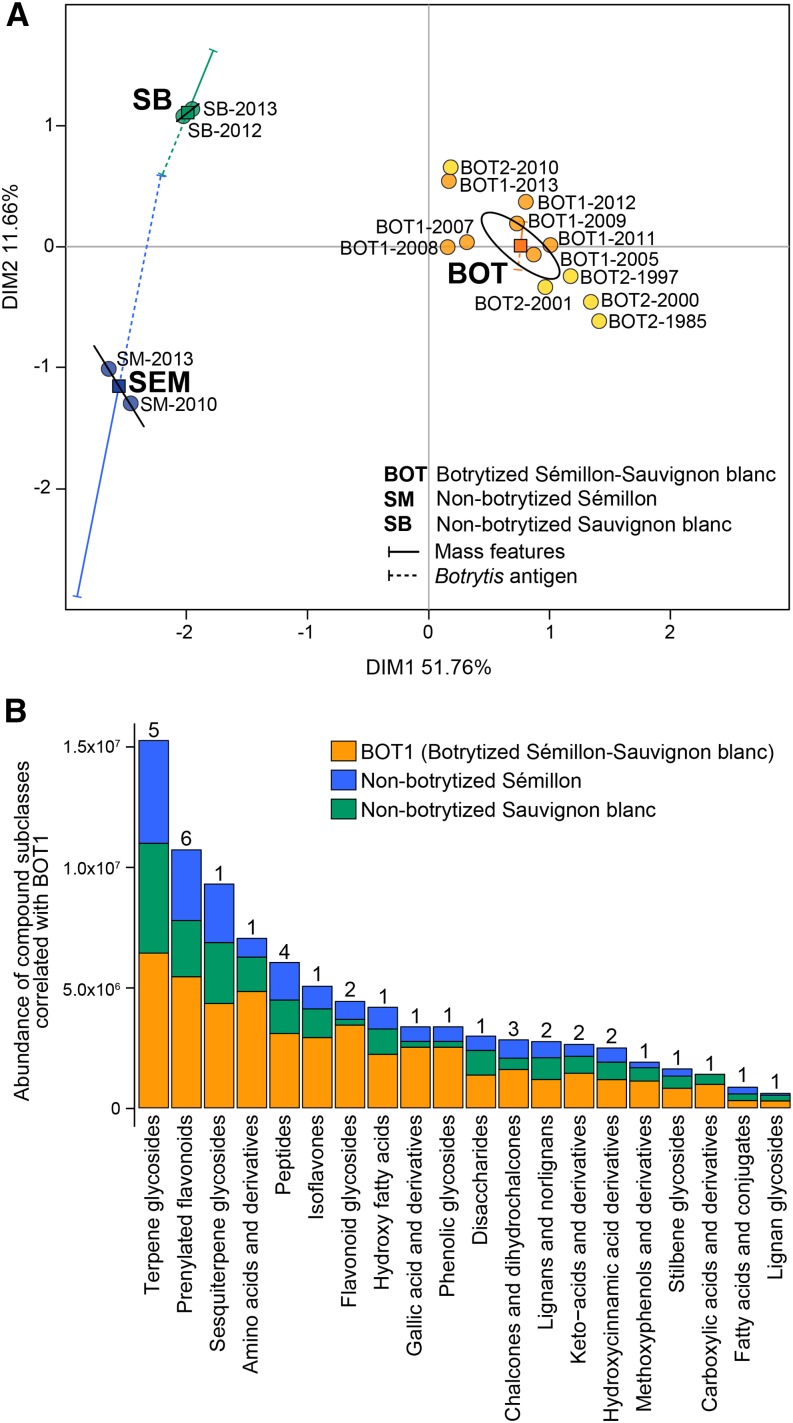
Figure 8.
Metabolite profiles of botrytized wines. A, MFA of botrytized and control (i.e. non-botrytized) wines using two types of quantitative variables (represented by vectors): accumulation of 299 mass features and the measurements of the B. cinerea antigen. Each point represents a different wine sample. The ellipse defines the confidence area (95%). Squares represent the corresponding centers of gravity for each wine class. DIM, Dimension. BOT1 and BOT2 are botrytized wines. B, Abundance of metabolites that significantly correlated (r ≥ 0.70, P ≤ 0.01) with BOT1 wines when compared with non-botrytized wines (Supplemental Table S16). Metabolites with unknown identities were not included. The number of metabolites per compound class is given on top of each bar.

