Figure 3.
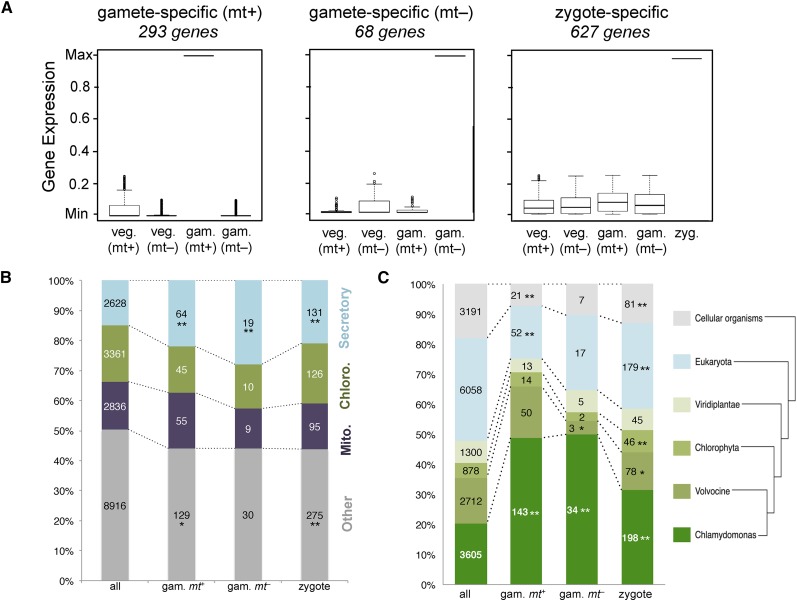
Gamete- and zygote-specific genes. A, Box and whisker plots of gene expression profiles for gamete- and zygote-specific genes. Values are plotted relative to the maximum expression value of each of the genes. A total of 293 and 68 genes were expressed specifically in MT+ and MT– gametes, respectively. A total of 627 genes were expressed specifically in zygotes. B, Localization predictions for proteins encoded by gamete-specific (gam. mt+ and gam. mt−) and zygote-specific genes, compared with all predicted proteins in the C. reinhardtii proteome (all). Data are plotted as the fraction predicted for each of four compartments, with total numbers indicated within each graph portion: secretory in blue; chloroplast (Chloro.) in green; mitochondria (Mito.) in purple; and other in gray. Values with asterisks are significantly different from the total proteome distribution (*, P < 0.05 and **, P < 0.01). C, Predicted protein groups as described in B are plotted according to the taxonomic distribution of encoded proteins from each category. From bottom (C. reinhardtii-specific proteins; dark green) to top (all cellular organisms; gray) are increasingly broad phylogenetic distributions. Samples with asterisks indicate significant enrichment or depletion in a taxonomic category relative to the distribution of all proteins (*, P < 0.05; and **, P < 0.01).

