Figure 5.
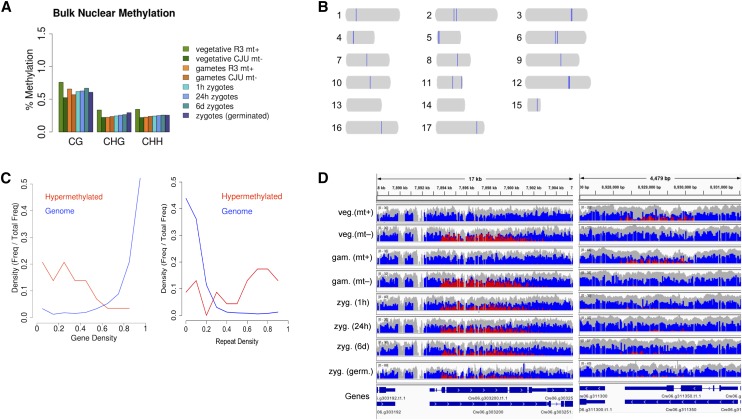
Nuclear methylation at different C. reinhardtii life cycle stages. A, Bulk averages of 5meC in the nuclear genome for each sample and categorized by the fraction of 5meC in each of three sequence contexts (CG, CHG, and CHH). B, Scaled representations of the 17 C. reinhardtii chromosomes, with 23 hypermethylated regions larger than 10 kb shaded in blue. C, Plots comparing gene and repeat densities of hypermethylated regions relative to the entire genome. D, Genome browser display of nuclear cytosine methylation frequency at two representative hypermethylated loci from chromosome 6. Two representative examples of strain-specific hypermethylated loci are shown side by side, with a gene track below for genomic context. In the coverage plot, blue represents unmethylated cytosines (converted by bisulfite treatment), red represents methylated cytosines (unconverted), and gray represents total coverage (including reads from the opposite strand that do not provide methylation information).

