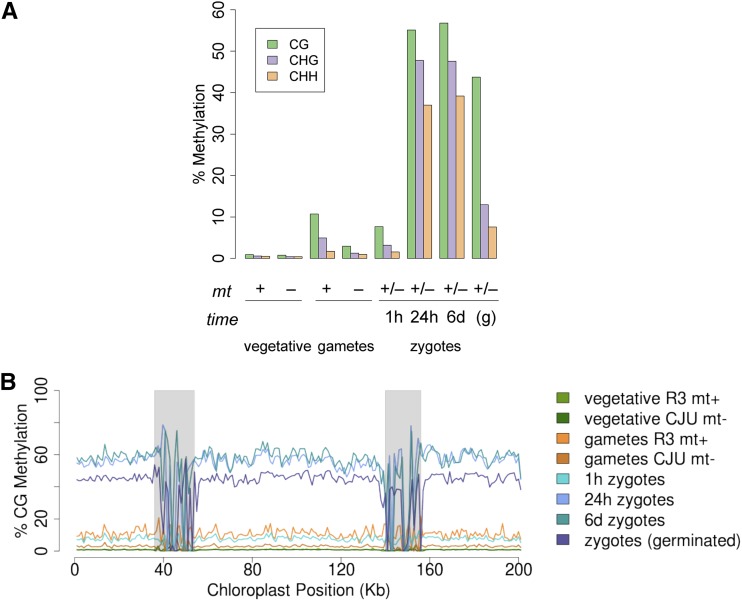
Figure 6.
Chloroplast genome methylation at different life cycle stages. A, Bulk cytosine methylation frequencies for cpDNA at different life cycle stages plotted for each methylation context. The mating type of each sample (+, −, or diploid +/−) and time of zygote development and germination (g) are shown below the graph. B, Plot of average CG methylation frequency for each sample in 1-kb bins across the chloroplast genome. The two inverted repeat regions are shaded in gray. Plots are color coded according to the legend at right.

