phenoVein is a user-friendly software tool designed for automated leaf vein segmentation and analysis of leaf vein traits, including a model-based vein width determination.
Abstract
Precise measurements of leaf vein traits are an important aspect of plant phenotyping for ecological and genetic research. Here, we present a powerful and user-friendly image analysis tool named phenoVein. It is dedicated to automated segmenting and analyzing of leaf veins in images acquired with different imaging modalities (microscope, macrophotography, etc.), including options for comfortable manual correction. Advanced image filtering emphasizes veins from the background and compensates for local brightness inhomogeneities. The most important traits being calculated are total vein length, vein density, piecewise vein lengths and widths, areole area, and skeleton graph statistics, like the number of branching or ending points. For the determination of vein widths, a model-based vein edge estimation approach has been implemented. Validation was performed for the measurement of vein length, vein width, and vein density of Arabidopsis (Arabidopsis thaliana), proving the reliability of phenoVein. We demonstrate the power of phenoVein on a set of previously described vein structure mutants of Arabidopsis (hemivenata, ondulata3, and asymmetric leaves2-101) compared with wild-type accessions Columbia-0 and Landsberg erecta-0. phenoVein is freely available as open-source software.
Leaf veins are an important aspect of leaf structure and responsible for both the mechanical support of leaves and the long-distance transport of water, nutrients, and photoassimilates (Onoda et al., 2011; Malinowski, 2013). The molecular mechanisms by which vascular tissues acquire their identities are yet largely unknown (Roschzttardtz et al., 2014), and there is high interest in analyzing and evaluating traits of veins or leaf venation networks and their genetic regulation. The impact of vein density on photosynthesis is a major investigated topic (Sack and Scoffoni, 2013). During the last decade, a positive correlation between leaf venation and photosynthesis has been observed (Sack and Holbrook, 2006; Brodribb et al., 2007). An optimization of photosynthetic rates was shown to occur by spatial coordination between leaf vein and stomatal densities (Zhang et al., 2012; Carins Murphy et al., 2014; Fiorin et al., 2015). Additionally, there is interest in the impact of vein density on interveinal distances (Dengler et al., 1994; McKown and Dengler, 2009) and the effect of climate, habitat, or growth form on vein density (Sack and Scoffoni, 2013; Scoffoni et al., 2015) or vein width with respect to leaf hydraulic conductance (Feild and Brodribb, 2013; Xiong et al., 2015). Other researchers are particularly interested in the evolution from C3 to C4 plants, which requires higher vein density (Gowik and Westhoff, 2011) and led to selecting for variation of vein density within species (e.g. in a mutant collection by Feldman et al., 2014).
Leaf venation studies analyzing traits of veins and venation networks are generally performed on microscopic images of leaves that are properly cleared after harvest. For very small leaves, e.g. the cotyledons or the first leaves (leaves 2–5) of Arabidopsis (Arabidopsis thaliana), basic traits, such as total vein length or vein density (vein length per leaf area), can be achieved manually. However, for larger leaves, manual vein segmentation may become tedious, and at least partially automated analysis is needed for studies on large series of leaf collections. Furthermore, the quantification of vein widths and in particular mean values of vein width of certain vein pieces of interest can hardly be achieved manually. Dedicated image processing tools are, therefore, needed to support researchers for fast and reliable data analysis.
A number of software tools have been published that are either specifically made or adapted to analyze leaf veins. These programs have some common properties, like image processing functionalities for vein/areole segmentation and trait extraction. However, they differ in handling strategies or vein parameter analysis methods. A general overview on plant image analysis tools is collected in an online database at http://www.plant-image-analysis.org (Lobet et al., 2013). Programs allowing automated or semiautomated analysis of leaf venation parameters are, for example, a method to extract leaf venation patterns (Rolland-Lagan et al., 2009), the leaf extraction and analysis framework graphical user interface LeafGUI (Price et al., 2011), the leaf image analysis interface LIMANI (Dhondt et al., 2012), the user-interactive vessel generation analysis tool VESGEN (Vickerman et al., 2009; Parsons-Wingerter et al., 2014), and the software network extraction from images NEFI (Dirnberger et al., 2015). Nevertheless, for the analysis of large-scale leaf vein phenotyping experiments, there are certain needs that are only partly covered by each of the approaches and programs mentioned above. Specifically, the following properties are needed: (1) automated vein segmentation with optional manual correction; (2) invariance of the segmentation procedure to inhomogeneous illumination or brightness variations in the leaf image; (3) automated determination of total vein length and projected leaf area; (4) a well-defined and automated determination of vein widths, which is, as far as possible, independent of user chosen thresholds; (5) ability to process large high-resolution images of whole leafs; and (6) full transparency of the source code as well as offline availability of the tool. To provide these functionalities, we developed the user-friendly analysis tool phenoVein. It features automated leaf vein segmentation based on advanced image filtering techniques and includes determination of various vein traits, particularly a model-based vein width estimation. phenoVein allows easy and fast visual control and manual correction on the automatically achieved skeleton of the veins enabled by a real-time overlay of the segmented leaf vein structures on the original image. The length measurement algorithm of phenoVein was validated against complete manual segmentation. We evaluated the impact of image resolution on the results, which has recently been discussed (Price et al., 2014; Sack et al., 2014), and tested whether the orientation (angle) of a leaf on an image may affect the results as suspected from image analysis theory on binary skeleton length measurements (Russ, 2011). To show the powerful phenotyping capabilities of phenoVein, we analyzed the venation traits of leaves of Arabidopsis at different developmental stages (cotyledons, pooled leaves 1 + 2, and leaf 6) harvested from previously described venation mutants and corresponding wild-type lines: asymmetric leaves2-101 (as2-101), ondulata3 (ond3), and hemivenata2 (hve-2) versus Columbia-0 (Col-0) and Landsberg erecta-0 (Ler-0; Semiarti et al., 2001; Alonso-Peral et al., 2006; Robles et al., 2010; Pérez-Pérez et al., 2011). We offer the source code of phenoVein to the public as open-source software that can be further adapted or improved (for details, see “Materials and Methods”).
RESULTS AND DISCUSSION
Here, we present the design of the image processing pipeline, emphasizing the unique features provided by phenoVein. This includes an accuracy analysis of measurements performed with phenoVein and a validation of phenoVein’s length and width measurement algorithms. Eventually, different vein traits of a set of leaf vein pattern mutants of Arabidopsis were analyzed using phenoVein. In Table I, the measured vein traits as well as the terminology and abbreviations used in this work are summarized together with equivalent notations used by other studies.
Table I. Summary of measured leaf venation traits, derived parameters, terminology, and abbreviating symbols used here as well as equivalent terms used by other studies.
| Venation Traits | Symbol | Definition | Unit | Equivalent Terminologies by Others |
|---|---|---|---|---|
| Measured traits | ||||
| Total skeleton length | L | mm | Total network length,c vascular pattern lengthd | |
| Projected leaf area | A | mm2 | ||
| No. of vein pieces | Nv | No. of edges,c no. of vascular elementsd | ||
| Piecewise vein lengtha | Li (i = 1 ... Nv) | mm | Edge lengthc | |
| Piecewise vein width | Wi (i = 1 ... Nv) | mm | Edge widthc | |
| No. of branching points | NBP | No. of nodesc | ||
| No. of ending points | NEP | Free-ending veinse | ||
| No. of areoles | NAR | No. of areoles,c no. of loopsf | ||
| Single interstitial areasb | Aj (j = 1 ... NAR) | mm2 | ||
| Derived traits | ||||
| Leaf vein density | DV | = L/A | mm mm−2 | Vein length per leaf area (VLA),e vascular densityd |
| Branching point density | DBP | = NBP/A | mm−2 | |
| Ending point density | DEP | = NEP/A | mm−2 | |
| Areole number density | DAR | = NAR/A | mm−2 | No. of vein areoles per leaf areae |
| Total vein area | AV | = ΣLi wi | mm2 | Total network 2D areac |
| Total areole area | AAR | = A − AV | mm2 | |
| Mean vein width | Wmean | = AV/L | mm |
A piecewise vein length results from the respective piecewise skeleton length between two branching points or a branching point and an ending point.
A single interstitial area differs from the respective single areole area, because the interstitial area includes most of the vein area as well (except for the area covered by the skeleton pixels).
Leaf Preparation and Image Acquisition
The software phenoVein can deal with all kinds of images of either whole leaves or leaf parts provided that the images show a reasonable contrast between the leaves and the background as well as between the veins and the surrounding areoles. This can be achieved by different approaches. Here, we applied a dedicated method to make Arabidopsis leaves translucent by a clearing protocol. The imaging setup provided light from the bottom of the sample, allowing us to take pictures with a standard digital single-lens reflex camera placed above the sample (“Materials and Methods”). For a precise segmentation of a leaf from the background, any overlap with other leaves or interfering structures (e.g. air bubbles) has to be avoided. In general, it does not matter whether the leaf is brighter or darker than the background, which implies that input images may originate from bright- or dark-field approaches. phenoVein is capable of reading and processing a number of standard image formats, such as jpg, png, 8bit-tif, 16bit-tif, and bmp.
Image Processing Sequence
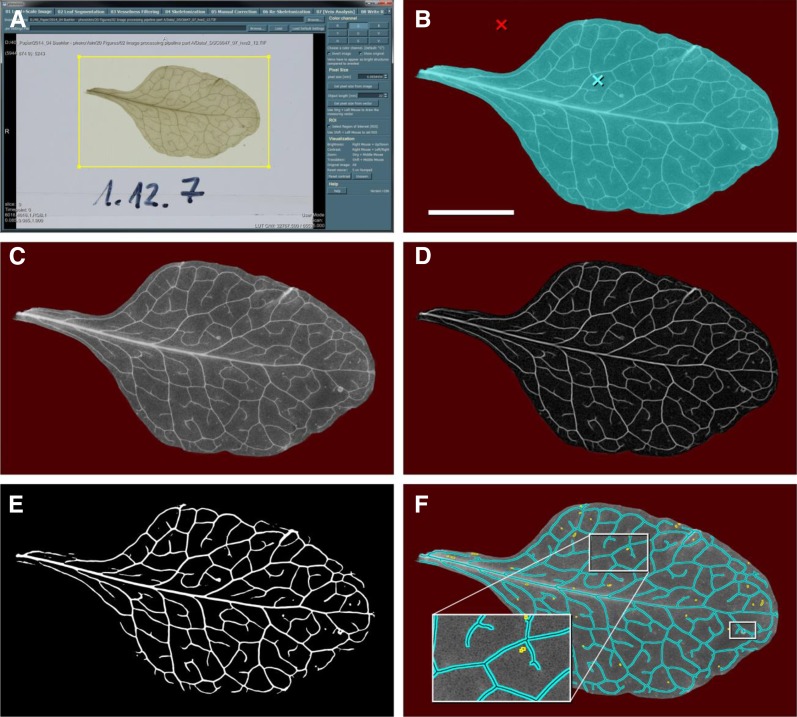
The software phenoVein implements a dedicated image processing sequence consisting of different steps, most of which are depicted in Figures 1 and 2: (1) data preprocessing and image segmentation of leaf from background; (2) filtering of vein structures (vesselness filtering); (3) binarization and skeletonization; (4) visual inspection and optional manual corrections; (5) vein length determination and evaluation; and (6) vein width estimation. These steps are described and discussed in the following paragraphs. Eventually, all results are written to output files (for details, see “Materials and Methods”).
Figure 1.
Workflow of the phenoVein image processing sequences. Part 1: segmentation of leaf veins. A, Photographic image of a cleared Arabidopsis leaf (hve-2; Fig. 8L) loaded on the start page of the graphical user interface of phenoVein. Here, a ROI was defined (yellow rectangle), the color channel for color to gray value conversion was selected, and pixel size was adjusted. B, Separation of leaf (cyan) and background (red) for the ROI denoted in A. C, The resulting gray value image of the leaf with the background shown in red. D, By processing the leaf image (C) with a vesselness filter, leaf veins were enhanced. E, A threshold-based binary vein mask of the filtered image (D). F, Skeletonization of the vein mask (cyan and black lines) overlaid on the original gray value image as shown in C for visual control; small unconnected components were automatically removed (yellow and black lines; magnified in the inset). The white rectangle at the tip of the leaf refers to Figure 2, illustrating part 2 of the phenoVein workflow. Bar = 5 mm (B–F).
Figure 2.
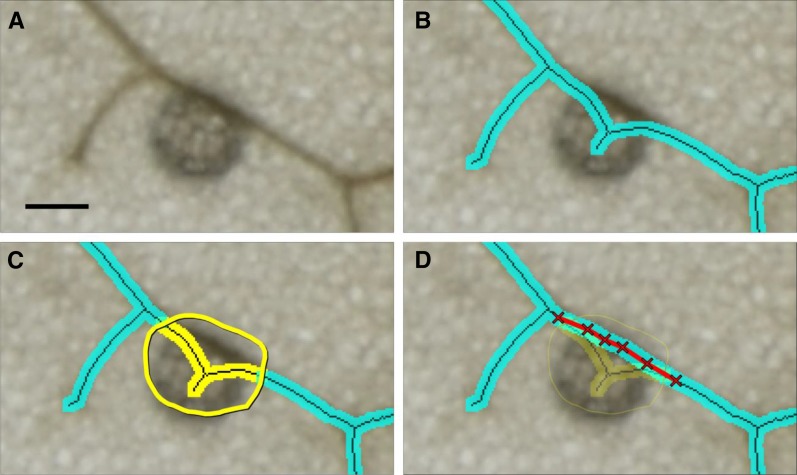
Workflow of the phenoVein image processing sequences. Part 2: manual corrections by visual inspection. The example is the magnified region of the Arabidopsis leaf (hve-2) denoted as a small white rectangle at the leaf tip in Figure 1F. A, Subsection of the original camera image with a disturbing particle on the leaf. B, Overlay of the skeleton segmented by phenoVein (compare with Fig. 1F), where the particle accidently resulted in an additional piece of vein. The manual correction tool of phenoVein allows for deleting undesired vein pieces or whole regions (C) and manual insertion of veins (D). The deleted area in D is shown with a user-defined transparency for visual control. Bar = 200 µm.
Data Preprocessing and Image Segmentation of Leaf from Background
After loading an image (Fig. 1A), a set of preprocessing steps needs to be performed. First, image length scale has to be set in order to allow length and projected area measurements in defined units (e.g. millimeters and millimeters2, respectively). phenoVein offers three options to determine the image length scale: (1) readout of image metadata (if existing), (2) manual input by the user, or (3) computation of the image length scale from a known object within the image (e.g. ruler). Second, phenoVein uses a gray value image for internal calculations; thus, input color images need to be converted to grayscale. Depending on the properties of the input images, different color conversion schemes might show different vein to areole contrast. To allow optimal contrast selection, the user can choose out of a set of color transformations a desired channel, either by selecting one of the red, green, and blue (RGB) channels of the input image or by conversion of the input image into one of the single channels of luminance and color decoding channels (YUV) or hue, saturation, and value (HSV) color spaces (Russ, 2011). The software also offers the possibility to crop an input image to a user-defined region of interest (ROI; Fig. 1A). This allows one to select a whole leaf or part of it for analysis. Images containing multiple leaves can be handled by analyzing each single leaf separately. If the ROI contains background, the leaf or the respective subsection is then separated from the background (Fig. 1, B and C) by a standard region-growing procedure to measure the analyzed leaf area, A, and run the vein segmentation only on that part of the image.
Vesselness Filtering
In a next step, the preprocessed input image is filtered with a multiscale vesselness filter (Fig. 1D) using the MeVisLab module Vesselness (MeVis Medical Solutions AG). This filter enhances pixels, which are part of a line or tubular-like structure more likely than others by calculating certain measures of the eigenvalues of the Hessian matrix for several scales of the image (Sato et al., 1997; Frangi et al., 1998).
A very handy and desired side effect of the vesselness filter is robustness against brightness variations in the input image, which might, for example, result from inhomogeneities in illumination or leaf thickness. This becomes obvious when comparing the bright area around the midrib in Figure 1C with the homogenous areole intensity in Figure 1D. The vesselness filter typically shows a decreased contrast at line crossings, which is compensated for by a morphological closing operation on the filtered image. This closing operator fills small dark gaps at the vein crossings, which usually leads to a reconnection of inadvertently disconnected veins. The filling gap size of the closing operation can be controlled by the user by direct visual inspection.
Binarization and Skeletonization
In the subsequent step, the user sets a threshold on the vesselness value at which pixels belonging to veins can be distinguished from those belonging to areoles; this is performed under visual inspection and results in a binary vein mask (Fig. 1E). The obtained mask does not necessarily represent the exact widths of the veins, because this depends on the chosen parameters of the vesselness filtering. However, the center of a single mask structure generally represents precisely the center of the underlying vein structure. This allows the application of a skeletonization algorithm, which is thinning the vein mask to a 1-pixel-wide skeleton structure (Selle et al., 2002). The skeleton obtained this way preserves vein topology and lengths of the single vein pieces of the binary vein mask (cyan structures in Fig. 1F). At this point, an automatic cleanup process removes small and unconnected vein pieces within the skeleton image (yellow skeleton pieces in Fig. 1F); the minimum size of a single object to be removed can be defined by the user.
Visual Inspection and Optional Manual Corrections
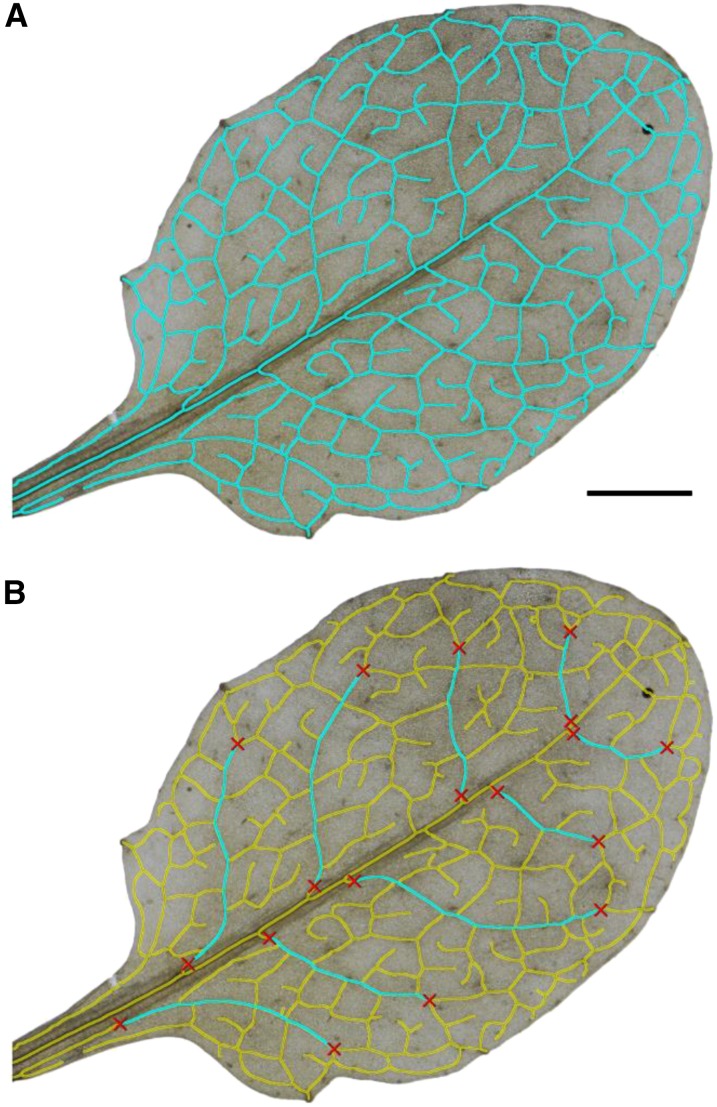
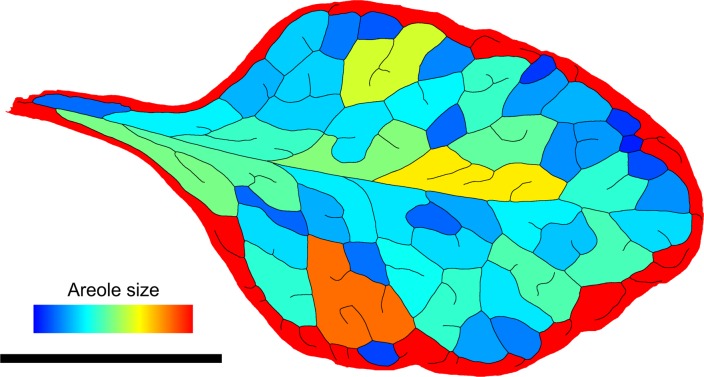
Depending on the image quality and possible artifacts, such as leaf damage, overlaying trichomes, or dirt, the obtained skeleton already gives a good representation of the underlying vein structure. If needed, the user can manually edit the skeleton by removing incorrectly assigned vein pieces or adding missing parts (Fig. 2). phenoVein offers two possibilities to remove undesired veins: veins of a selected region of the leaf can be erased by (1) drawing a closed line using the computer mouse (Fig. 2C) or (2) clicking a check mark on single vein pieces, which results in recognition and erasing of the vein until a branching point or an ending point is reached (not shown). All removal steps can be cancelled or corrected in case the user accidentally deleted certain structures. The insertion of missing parts is possible with various drawing tools: a linear polyline (as shown in Fig. 2D), an automated live wire (Fig. 3), a spline-based line, or a freehand line (the two latter options are not shown). The live wire is particularly helpful when the user is interested in certain vein structures only (e.g. first or second order veins). In this case, phenoVein offers a feature to mask out all previously detected veins but still allows for using them for the live wire segmentation. With this feature, arbitrary vein segments can be selected and redrawn by simply determining the start and end points of the structure of interest, and the live wire will deliver the shortest connecting vessel (Fig. 3B). After finalization of the visual inspection, phenoVein provides a calculation of areole size distribution and a visualization by false colors (Fig. 4).
Figure 3.
Live wire segmentation feature. A, Segmented veins of a complete leaf 6 of Col-0 (cyan). B, All segmented veins from A were masked out (yellow), and secondary order veins were segmented using the automated life wire segmentation (cyan). Starting and ending points were set manually (red crosses). The life wire segmentation was guided by the underlying skeleton from A. Bar = 5 mm.
Figure 4.
False color image showing the distribution of interstitial area sizes of the skeletonized Arabidopsis leaf (hve-2) from Figure 8L. The area is encoded from 0 mm2 (blue) to 7.5 mm2 and larger (red). This area distribution image is part of the set of output files of phenoVein. Bar = 5 mm.
Vein Length Determination and Evaluation
The length of the final skeleton is determined using a weighted pixel counting approach (Russ, 2011). In this method, all horizontal and vertical connections between skeleton pixels are counted and multiplied by 1, whereas all diagonal connections between skeleton pixels are counted and multiplied by  . This simple method systematically overestimates skeleton length. A correction by a weighing factor of 0.948 considerably reduces the intrinsic bias of the length estimation (Dorst and Smeulders, 1987).
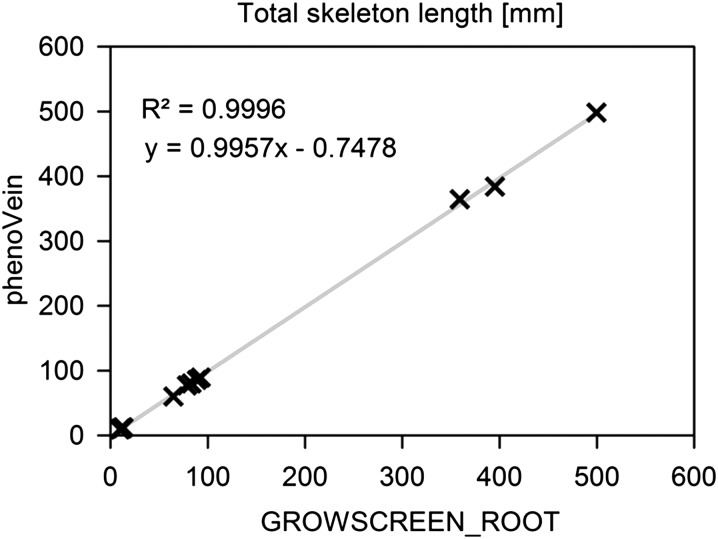
Vein length determination performed with phenoVein was validated by comparison with a manual drawing tool originally designed to measure root length as part of the program package GROWSCREEN_ROOT (Nagel et al., 2009). Both methods were used to segment the veins of several different leaves (Col-0; 10 samples of cotyledon leaves, 5 samples of leaves 1 + 2, and 3 samples of leaf 6). A high correlation was observed between the results of phenoVein and GROWSCREEN_ROOT (R2 = 0.9996; Fig. 5). The manual segmentation took about 20 min of pure drawing time per leaf for the leaf 6 samples, whereas with phenoVein, the results were obtained within 1 to 2 min on a standard personal computer (Windows 7, Intel i7-2600, 32 GB RAM).
Figure 5.
Validation of length measurement of phenoVein. Veins of cotyledons and leaves 1 + 2 and 6 (Col-0) were segmented using phenoVein and compared with a manual segmentation feature of the root image analysis software package GROWSCREEN_ROOT (Nagel et al., 2009). The total length measured by phenoVein was fitted linearly to the data from GROWSCREEN_ROOT (gray curve); the fitting parameters are shown in the respective linear function.
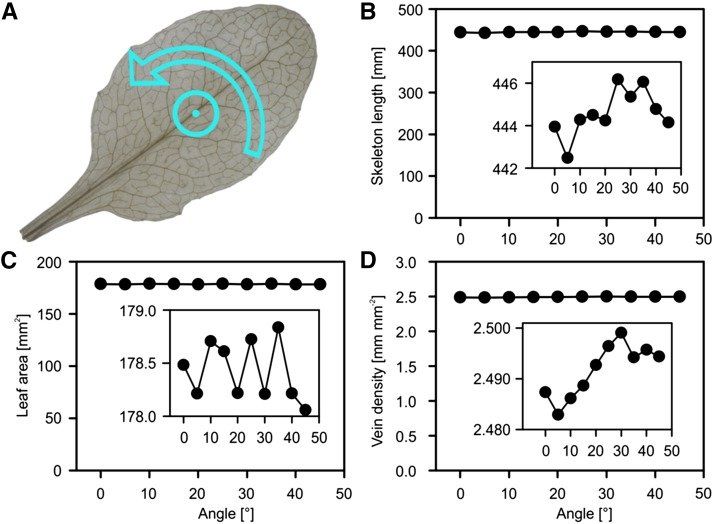
Length measurement of digitized skeletons might possibly depend on the orientation and shape of the measured structures, as is known from image analysis theory (Russ, 2011). To investigate the potential impact of orientation on vein length determination, we tested the rotation invariance of phenoVein’s length and leaf area measurements. Angle dependence was less than 0.6%, 0.1%, and 0.8% for leaf area, skeleton length, and vein density, respectively (Fig. 6).
Figure 6.
Rotation invariance of skeleton length, leaf area, and vein density measurement. A, A leaf image (Col-0; leaf 6) illustrating the center of rotation. B and C, Total skeleton length and projected leaf area measured by phenoVein versus rotation angle (0°–45°). D, Vein density resulting from B and C. The insets show the same data as the full diagrams but with zoomed y axes.
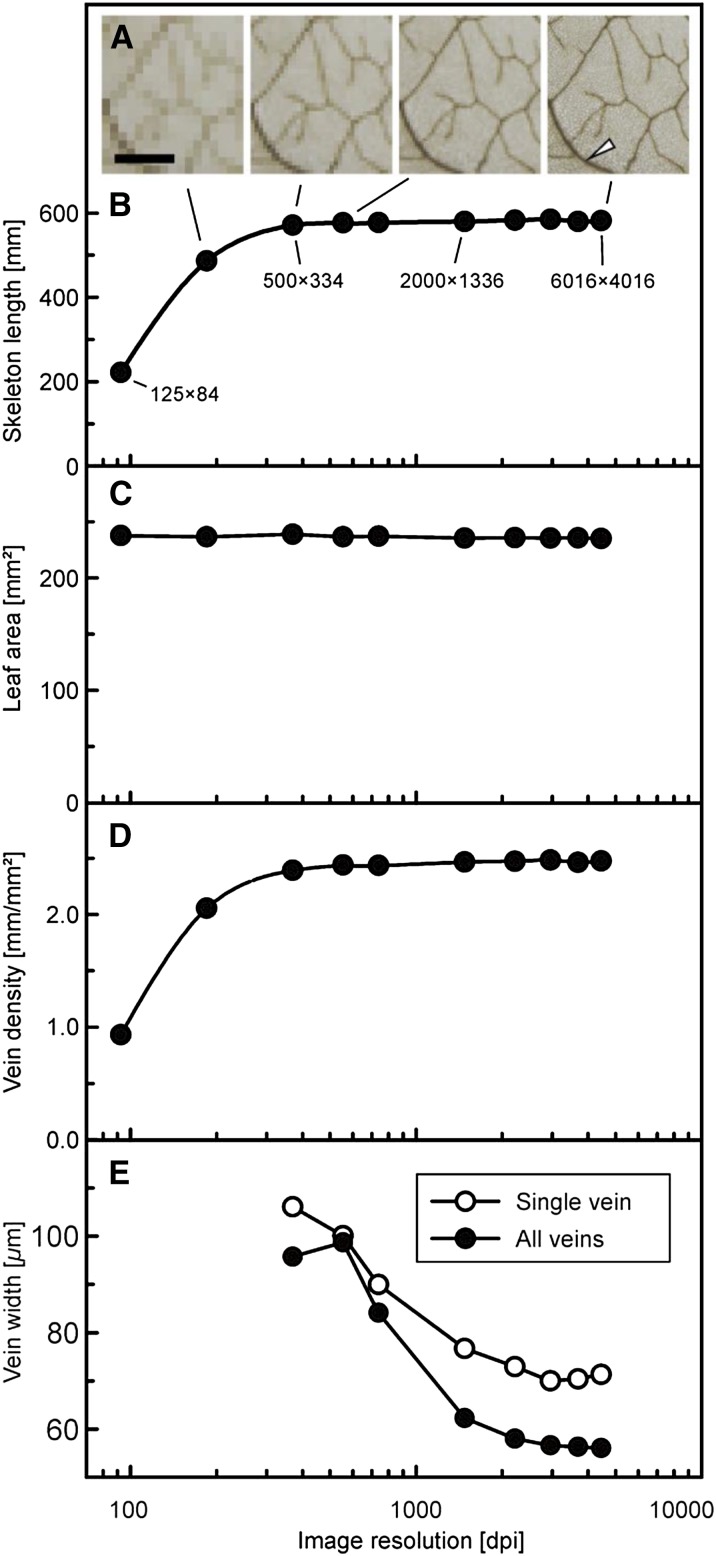
Recently, a discussion emerged in the literature dealing with a potential impact of image magnification on vein length and density estimation (Price et al., 2014; Sack et al., 2014). In their study, Price et al. (2014) claimed that estimates of leaf vein density increase with increasing image magnification, which was disproven by Sack et al. (2014). Here, we analyzed the effect of image resolution on vein density measured with phenoVein. For this purpose, a representative image of an Arabidopsis leaf with high resolution was down-sampled to several lower resolutions to simulate different magnifications (Fig. 7A). Respective skeleton lengths, leaf areas, and the mean width of all veins were determined automatically by phenoVein without any manual corrections. Below a minimal resolution (approximately 400 dots per inch [dpi]), a loss of thin structures results in a considerable decrease of skeleton length (Fig. 7B), whereas leaf area is not affected (Fig. 7C). In consequence, leaf vein density requires a minimal image resolution (Fig. 7D). For image resolutions higher than the minimally required resolution, leaf vein density remains constant, which is consistent with the conclusions by Sack et al. (2014) that vein density does not increase intrinsically with magnification.
Figure 7.
Sensitivity of major leaf traits regarding image resolution. The original image with a native resolution of 6,016 × 4,016 pixels was down-sampled using bicubic interpolation. A, Example subsection of a leaf image (Ler-0; leaf 6) with different resolutions. Bar = 1 mm. B, Total skeleton length of segmented veins of the complete leaf without any manual corrections versus image resolution. C, Projected leaf area versus image resolution. D, Vein density versus image resolution. E, Mean width of all veins (black circles) and the single vein piece highlighted by an arrow in A (white circles) versus image resolution. For estimation of the vein widths in E, no data were available for the images with 125 × 84 and 250 × 167 pixels, because such low resolution was not sufficient to deliver a stable fit.
Vein Width Estimation
After the vein segmentation is completed, the average width of either selected vein pieces or all vein pieces can be measured automatically. A vein piece is the section between two branching points, between a branching point and an ending point, or between two arbitrary end points marked by the user as shown in Figure 3B. The vein width is defined here as the mean distance between two opposing edges in image intensity separating a vein from the neighboring areole(s). The method to estimate the vein width is a model-based vein edge detection approach that fits an enveloping function around the respective vein piece. The mathematical details of this method are given in “Materials and Methods.”
In most software tools dedicated to analyzing vein traits, the estimation of vein width is not explicitly implemented (Rolland-Lagan et al., 2009; Dhondt et al., 2012). In the software LeafGUI, vein width calculation is based on the determination of the vein area and depends on user-defined thresholds (Price et al., 2011, 2012). With the software tool NEFI (Dirnberger et al., 2015), the width of veins can be visualized by using a watershed algorithm, but no data or validation measurements of the algorithm were presented.
Different from skeleton length and vein density (Fig. 7, B and D), the estimation of vein widths of Arabidopsis becomes independent of resolution only above a minimal image resolution of 3,000 dpi (Fig. 7E). For a general validation of the model-based vein width estimation, artificial images with straight or curved lines were created using CorelDraw (Corel Corporation, version 16.0.0.707) with varying diameters and orientation angles, which then were analyzed with phenoVein. The expected structure widths were satisfyingly represented by phenoVein for structures with a minimum width of 5 pixels (data not shown), which is depicted roughly in the series of pictures in Figure 7A showing the same image with different resolutions. When veins are represented by too few pixels (e.g. <5 pixels depending on the smoothness and noise of the image), this may lead to an intrinsic overestimation and thus an erroneous value of the vein width as shown in Figure 7E. This would also impede the estimation of the total areole area, AAR, which is calculated here as the projected leaf area, A, minus the area covered by the vein, AV (Table I). We are convinced that the method presented here using a model-based estimate of vein widths can be considered a reliable and well-defined approach. This method also can be extended for a comprehensive error analysis of the fitted model parameters to calculate confidence intervals of the width of each single vein piece (e.g. by bootstrapping; Press, 2007).
Analysis of Venation Pattern Mutants of Arabidopsis
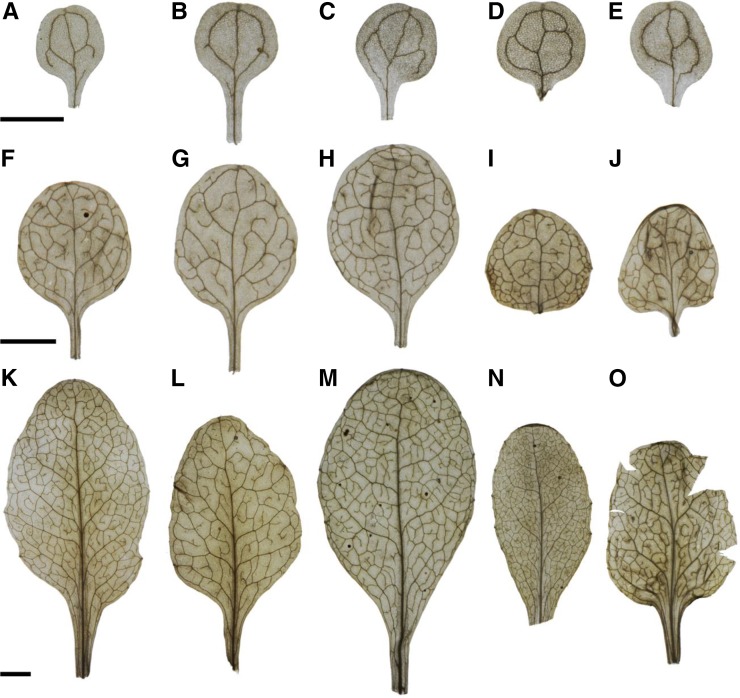
To evaluate the functionality of phenoVein, we compared the venation patterns of known venation mutant lines (as2-101, hve-2, and ond3) and their corresponding wild-type lines of Arabidopsis (Col-0 and Ler-0) at three different developmental stages: the cotyledons of 14-d-old plants, the pooled leaves 1 + 2 of 14-d-old plants, and the fully developed leaf 6 of 30-d-old plants (Fig. 8). We aimed to analyze mutant lines exhibiting varying vein densities compared with the wild type.
Figure 8.
Photographic images of cleared leaves at different developmental stages of five different genotypes of Arabidopsis. A to E, Cotyledons. F to J, Leaf 1 or 2. K to O, Leaf 6. Leaves of two wild-type accessions are shown in Col-0 (A, F, and K) and Ler-0 (C, H, and M). Leaves of three mutants in hve-2 (B, G, and L), ond3 (D, I, and N), and as2-101 (E, J, and O). For visualization only, brightness and contrast have been adjusted equally. Bar = 2.5 mm.
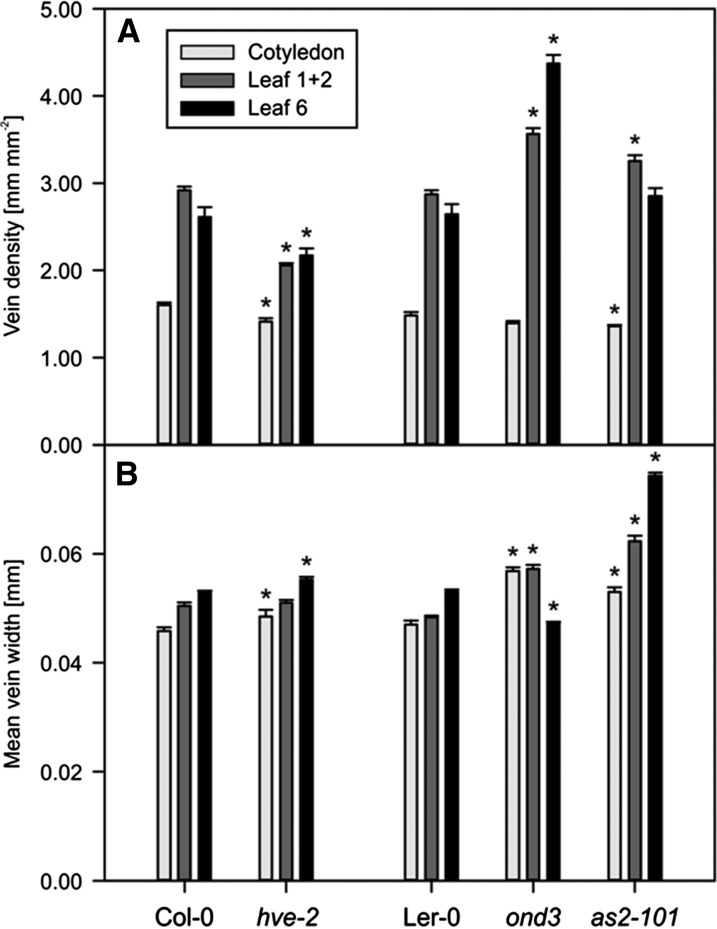
In the mutant hve-2, HVE encodes a Cullin-Associated and Neddylation-Dissociated1 (CAND1) protein involved in the auxin signaling pathway (Alonso-Peral et al., 2006; Robles et al., 2010). Compared with Col-0 (Fig. 8, A, F, and K), the analysis of hve-2 showed lower vein densities in all analyzed developmental stages (Figs. 8, B, G, and L and 9A). The difference in the venation pattern was highest in leaves 1 and 2, in which hve-2 displayed around 71% of Col-0 vein density, which is in agreement with the work by Alonso-Peral et al. (2006). This reduction in vein density was associated with lower areole density and similar free ending point density compared with Col-0, indicating that the hve-2 major veins (secondary, tertiary, and quaternary) but no minor veins were interrupted (Table II; for a complete table containing the raw output of phenoVein for all samples, see Supplemental Table S1.). The mean vein width of cotyledons and leaf 6, not accounted by Alonso-Peral et al. (2006), was significantly increased in hve-2 compared with Col-0 (Fig. 9B) based on slightly smaller fractions of thin veins (Supplemental Fig. S1)
Figure 9.
Major results of analysis of leaves of Arabidopsis wild types and mutants for cotyledons, leaves 1 + 2, and leaf 6. A, Vein density distribution. Error bars indicate se (n = 10). B, Mean vein widths. Means were calculated from widths of all vein pieces (pooled) of 10 leaves for each genotype weighted by individual vein piece length. Error bars indicate se. *, Statistically significant differences (P < 0.05) comparing a mutant line with its corresponding wild type: hve-2 versus Col-0 and ond3/as2-101 versus Ler-0 (Table II).
Table II. Summary of venation pattern results for traits DV (vein density; millimeters millimeters−2), DBP (branching point density; millimeters−2), DEP (ending point index; millimeters−2), and DAR (areole no. density; millimeters−2).
Values are mean values ± sd (n = 10).
| Leaf Type and Trait | Col-0 | hve-2 | Ler-0 | ond3 | as2-101 |
|---|---|---|---|---|---|
| Cotyledons | |||||
| DV | 1.60 ± 0.08 | 1.41 ± 0.13a | 1.48 ± 0.12 | 1.39 ± 0.08 | 1.36 ± 0.05a |
| DBP | 0.71 ± 0.16 | 0.56 ± 0.11a | 0.72 ± 0.20 | 0.68 ± 0.12 | 0.58 ± 0.05 |
| DEP | 0.20 ± 0.14 | 0.14 ± 0.11 | 0.15 ± 0.11 | 0.13 ± 0.11 | 0.17 ± 0.10 |
| DAR | 0.47 ± 0.09 | 0.35 ± 0.09a | 0.45 ± 0.12 | 0.42 ± 0.09 | 0.39 ± 0.05 |
| Leaves 1 + 2 | |||||
| DV | 2.92 ± 0.14 | 2.06 ± 0.07a | 2.87 ± 0.14 | 3.56 ± 0.21a | 3.25 ± 0.21a |
| DBP | 3.39 ± 0.33 | 1.60 ± 0.15a | 3.58 ± 0.38 | 6.35 ± 0.74a | 4.37 ± 0.64a |
| DEP | 0.87 ± 0.27 | 0.76 ± 0.13 | 0.95 ± 0.18 | 1.84 ± 0.25a | 1.29 ± 0.18a |
| DAR | 1.32 ± 0.18 | 0.47 ± 0.05a | 1.37 ± 0.17 | 2.37 ± 0.40a | 1.59 ± 0.30 |
| Leaf 6 | |||||
| DV | 2.61 ± 0.38 | 2.17 ± 0.29a | 2.64 ± 0.39 | 4.37 ± 0.34a | 2.80 ± 0.35 |
| DBP | 2.67 ± 0.93 | 1.84 ± 0.42a | 3.08 ± 0.98 | 8.70 ± 1.45a | 3.17 ± 0.82 |
| DEP | 0.94 ± 0.26 | 0.81 ± 0.18 | 0.82 ± 0.2 | 1.75 ± 0.13a | 1.19 ± 0.19a,b |
| DAR | 0.92 ± 0.38 | 0.56 ± 0.16a | 1.15 ± 0.41 | 3.53 ± 0.74a | 1.03 ± 0.39 |
Statistically significant differences (P < 0.05) comparing a mutant line with its corresponding wild type: hve-2 versus Col-0 and ond3/as2-101 versus Ler-0 (standard Student’s t test).
Some of the as2-101 leaves 6 were cut to allow flat imaging. For this reason, the number of free ending points NEP found by phenoVein was increased inadvertently by the cut veins. These cases were corrected manually by subtracting the undesired ending points. The complete data set containing the results of phenoVein are listed in Supplemental Table S1.
The second analyzed mutant was ond3, which is an Ethyl methanesulfonate mutant in Ler-0 background (Pérez-Pérez et al., 2011). We were able to reproduce the results obtained by Pérez-Pérez et al. (2011) by showing that ond3 (Fig. 8, D, I, and N; Table II) had a significantly higher vein density in leaves 1 + 2 and 6 but not in the cotyledons compared with Ler-0 (Fig. 8, C, H, and M).
The increase in vein density in the ond3 mutant was around 1.2-fold in leaves 1 + 2 and 1.7-fold in leaf 6. This increase in vein density was associated with an increase in the areole density. Moreover, ond3 showed a higher ending point density, which was 2.2-fold compared with Ler-0 (Table II). We conclude that the major and minor veins were disrupted in the ond3 mutant because of its higher areole and ending point densities than those observed in Ler-0. Interestingly, the different leaf types showed different results with respect to vein width: although the cotyledons and leaves 1 + 2 had thicker veins, the mean vein width of leaf 6 was smaller compared with Ler-0 (Fig. 9B) because of a higher fraction of thin veins (Supplemental Fig. S1), possibly compensating for the largely increased vein density in this mutant (Fig. 9A)
To challenge the capability of phenoVein, we analyzed the venation pattern of as2 mutants. AS2 is required for the development of veins and a symmetric and flat lamina. When the gene is knocked out, the leaves will be curled, which makes it difficult to acquire images for full leaves using microscopy (Semiarti et al., 2001; Iwakawa et al., 2002); this was also a challenge here, as can be seen in Figure 8O. We found that as2-101 had lower vein density at the cotyledon stage, whereas in leaves 1 + 2, the mutant displayed a higher vein density compared with Ler-0; for leaf 6, no significant difference was observed. Because no difference was observed in the areole density between as2-101 and Ler-0 in leaves 1 + 2, we hypothesize that the increase in vein density was because of an increase in the number of freely ending minor veins. Indeed, the as2-101 ending point density was 1.4-fold that of Ler-0 (Table II). Unlike what was previously shown by Semiarti et al. (2001), we found that leaves 1 + 2 of as2-101 have higher vein densities than Ler-0 (Table II). The increase in vein density is caused by an increase in minor veins that do not loop, reflected here by a higher ending point density (Table II). Although vein density in as2-101 showed no clear direction of response for the three leaf stages compared with Ler-0 (Fig. 9A), the mean vein widths were clearly increased (Fig. 9B). In Supplemental Fig. S1, it becomes obvious that, for leaves 1 + 2 and in particular, leaf 6, the sharp peaks in vein width distribution became flatter with a shift to larger vein widths.
CONCLUSION
We demonstrate the functionality of phenoVein by analyzing the venation pattern of hve-2, ond3, and as2-101 mutant lines. Our analysis tool not only enables us to measure vein density but also can obtain important traits, like the areole and branching point density, as well as a model-based estimation of vein widths, which can enhance our understanding of the developmental cues controlling venation patterning.
Other unique features contributing to better handling and accuracy of phenoVein are (1) selection of color channels of various color spaces (RGB, HSV, or YUV) for optimal vein/areole contrast, (2) an easy procedure to determine image scaling (pixel size), and (3) the application of vesselness filtering to enhance linear structures, which in particular makes vein detection less sensitive to color/brightness gradients.
For Arabidopsis, the combination of the presented leaf clearing and imaging protocols enables a straightforward segmentation of leaf to background as well as a decent contrast of the leaf veins to the surrounding areoles. At the same time, trichomes on the leaf do not show up on the image, which simplifies the automated segmentation process with phenoVein enormously.
Although automated classification of vein orders was not implemented, phenoVein allows a user-friendly manual segmentation of certain veins of interest. For plant species that allow establishing adequate vein order classification rules as well as leaf images of sufficient quality, an automated classification is highly promising and a challenge for future software implementations. The current output images of phenoVein allow a subsequent application to already analyzed images if such an algorithm is developed in the future. Advanced traits like, for example, the spatial distribution about free ending vein points or certain measures of areole size can be extracted subsequently out of the binary skeleton image, which is also part of the output files of phenoVein.
The combined use of a camera for image acquisition and phenoVein for venation analysis can be principally applied for other species as well, allowing, for example, the performance of evolutionary studies. Nevertheless, the capability of phenoVein to measure other species automatically strongly depends on image quality. Here, the use of optimized clearing and imaging protocols can significantly improve the automated analysis of phenoVein and avoid tedious manual corrections. Species with extreme characteristics like, for example, exceedingly high vein densities or veins with high differences in vein width (very thin veins attached to comparatively thick veins) might require customization of phenoVeins segmentation algorithms, which is still the subject of ongoing investigations.
In short, we provide a unique tool that enables fast image acquisition and venation analysis of complete leaves of all sizes. The total time required for the analysis of the sixth 30-d-old Arabidopsis leaf was about 1 to 4 min depending on the leaf size and image quality, making phenoVein a useful tool for large-scale analysis, such as performing genome-wide association mapping.
MATERIALS AND METHODS
Plant Material, Growth Conditions, and Leaf Clearing
The following Arabidopsis (Arabidopsis thaliana) lines were analyzed in this study: Col-0 (European Arabidopsis Stock Centre [NASC] ID no. N22681), Ler-0 (NASC ID no. N28445), as2-101(NASC ID no. N16274), hve-2 (Robles et al., 2010), and ond3 (Pérez-Pérez et al., 2011). Seeds were sterilized by adding 95% (v/v) ethanol followed by 4% (v/v) HCl and then washed three times with water. Seeds were put on humid freshly prepared soil and vernalized at 4°C for 7 d in the dark. Plants were grown under long-day conditions (16-h-light/8-h-dark cycle) at 23°C with 40% humidity.
The cotyledons and leaves 1 + 2 (pooled) were harvested from 14-d-old plants, whereas the fully developed leaf 6 was taken from 30-d-old plants. The petioles were cut, and the leaves were stored in a cold fixation solution composed of methanol:acetic acid (55:2, v/v) for 1 to 2 d. The leaves were cleared with a mixture of ethanol (water free; 99%):acetone:methylketone (approximately 94:5:1, v/v/v; Rotisol; Carl Roth GmbH) by incubation for 4 h at 60°C. After cooling down, the leaves were rinsed two times with water, put upside down onto a microscope slide with water on it, and covered with a cover glass.
Image Acquisition
Images of the cleared leaves were taken with a NIKON D600 Single-Lens Reflex Camera (Nikon GmbH) equipped with a macro-objective (AF-S VR Micro-Nikkor 105-mm f/2.8G IF-ED; Nikon). Samples were positioned close to the minimal focus distance of the objective. With a native sensor resolution of 6,016 × 4,016 pixels, the pixel size of the images was about 5.7 µm at a given field of view of 3.4 × 2.3 cm2. The image acquisition was performed in a dark room using transmitted background illumination only. A standard Liquid-crystal display (LCD) desktop monitor (L568AS; 17 in; EIZO Europe GmbH) was diverted as the light source, allowing us to quickly define custom light-field sizes and color compositions. Eventually, a white rectangle with the size of the field of view of the camera was displayed on the screen directly below the sample for image acquisition to avoid ambient scatter light disturbances. The images were saved as Nikon’s raw format and converted to 16-bit TIFF images using the software ViewNX-2 (version 2.9.0; Nikon).
Mathematical Description of Vein Width Calculation
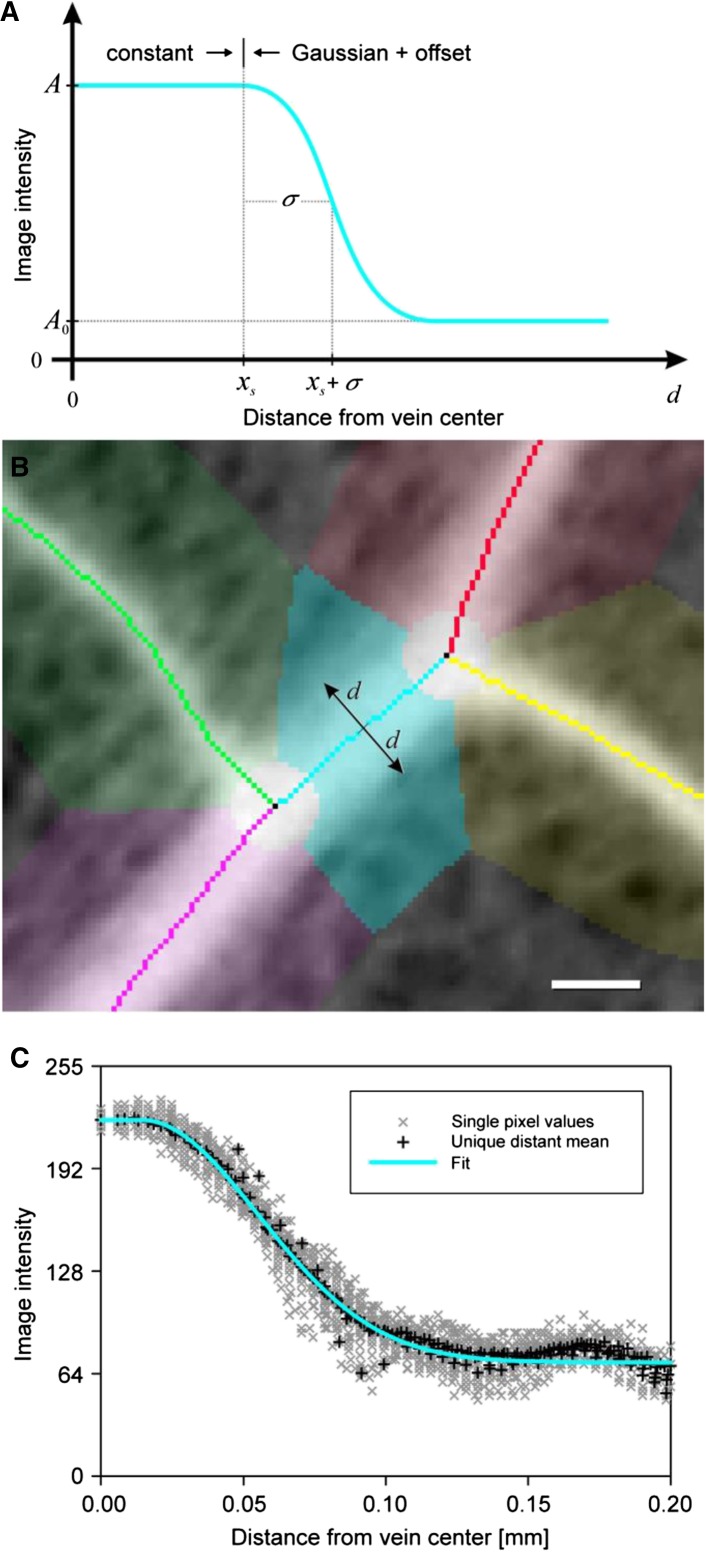
The procedure of the model-based vein width estimation is depicted in Figure 10. In general, we assume that the vein has a certain constant brightness A and that the respective areole is darker with a constant brightness A0. The vein edge is defined by the signal transition from the vein to the areole starting at distance xs from the vein center (i.e. the skeleton). This transition is assumed to be continuous and is modeled as the right one-half of a Gaussian function with width σ. Here, x is the shortest distance to the vein center (next closest skeleton pixel):
 |
(1) |
The general shape of the vein brightness modeling function ve is depicted in Figure 10A. The surrounding area of a vein is composed of all pixels closest to this vein within a maximum distance set by the user (Fig. 10B, cyan area). The intensities of all pixels within this area are plotted against their individual shortest distances to the skeleton (Fig. 10C, gray scatterplot). Pixel values with identical shortest distances to the skeleton xk are averaged to a single mean value for performance reasons (Fig. 10B, black scatterplot). The model function ve with its four parameters A, A0, σ, and xs is then least squares fitted to these pixel values (Fig. 10C, cyan curve) using a nonlinear Levenberg-Marquardt optimization routine (Levenberg, 1944; Marquardt, 1963).
Figure 10.
Vein edge detection model and estimation of vein widths. A, Sketch of the vein edge model (compare with Eq. 1). The model function assumes a constant brightness A of pixels representing a vein from its center to the vein edge. The vein edge itself as well as the areole region are modeled by a smooth half-Gaussian function of width σ starting at position xs. The areole region is approximated by the tail of the Gaussian function quickly converging to A0. B, Magnified subsection of a leaf photograph with venation network where the image has been inverted to brighten veins over background. Single vein skeleton pieces and their respective environments are highlighted with different colored pixels. Each colored pixel belongs to its respective next closest skeleton pixel. A vein piece of interest is highlighted and shown in cyan. Bar = 100 µm. C, The intensities of all pixels within the cyan area are plotted versus their respective shortest distances to the middle of the vein (gray scatterplot). For performance reasons, gray values with a unique distance to the skeleton are averaged (black scatterplot). These averaged pixel values are then least squares fitted by the vein edge model (cyan fit curve). The fitted parameters xs and σ are the basis for vein width estimation in Equation 3.
The minimized cost function r(xk) (Eq. 2) is defined as the weighted difference of the averaged pixel values pk and the model function ve evaluated at the discrete distance xk (with k = 1 ... no. of averaged pixels). This difference is weighted by multiplying with the number of pixels nk that were used for averaging and the reciprocal of the distance xk to make the fit more robust (i.e. pixel values closer to the skeleton have a higher weight than remote pixel values, preventing the optimizer to run into remote local minima):
 |
(2) |
If this fit is representing the data well enough (i.e. the sum of squared differences is smaller than a certain threshold or by visual inspection of the fitting plot), the fitted parameters xs and σ are used to estimate the mean width wi for the respective ith vein piece:
 |
(3) |
with  being the full width at half maximum factor of the Gaussian function.
Instead of the Gaussian function as an approximation for the vein edge, several other edge functions (e.g. arccotangens, error function, or Heaviside step function) could be used but have not been implemented in phenoVein. Our choice is supported by the ability of the Gaussian to represent the involved smoothing processes: the estimation process includes averaging, because in most cases, the width will not be strictly constant along a selected vein piece, and the limited resolution of camera images leads to partial volume effects, causing a blurring of leaf vein images.
Writing Results to Output Files
All segmentation results and a summary of the vein analysis parameters are written to a user-specified output directory. The output files comprise the following images: leaf mask, binary skeleton, false-colored areole size distribution image (Fig. 4), the cropped part of the original image, and a skeleton overlay on the original image. Additionally, a comma separated value (.csv) file is created containing values of all measured traits as well as a chosen set of derived parameters (Table I). The .csv file can be processed with standard spreadsheet applications.
Software Design and Hardware/Software Requirements
phenoVein has been implemented as a plugin within the development environment MeVisLab (MeVis Medical Solutions AG; free of charge download of MeVisLab SDK unregistered at www.mevislab.de). For this version of phenoVein, an installation of MeVisLab is a prerequisite before phenoVein can be installed. To edit and run an adapted version of the source code of phenoVein, a specific SDK license of MeVisLab is required. The source code of phenoVein is published in a publicly accessible open-source code repository. The link to this repository as well as a signed and executable version of phenoVein can be found at www.phenovein.de.
Minimum recommended hardware and software requirements: a monitor with a minimum resolution of 1,650 × 1,050 is recommended as well as a personal computer with 8 GB RAM and Microsoft Windows 7 (www.microsoft.com; Microsoft Corporation). phenoVein has been developed and tested with MeVisLab, version 2.6.1; earlier versions are not supported. In theory, phenoVein should run under LINUX and OS X as well but was not tested.
Supplemental Data
The following supplemental materials are available.
Supplemental Figure S1. Histograms showing relative frequency of vein widths for all mutants (hve-2, ond3, and as2-101) and respective wild types (Col-0 and Ler-0).
Supplemental Table S1. Merged output of phenoVein for cotyledons, leaves 1+2 and leaf 6 for all mutants (hve-2, ond3, and as2-101) and wild types (Col-0, Ler-0).
Supplementary Material
Acknowledgments
We thank Esther Breuer (Institute of Bio- and Geosciences: Plant Sciences, Forschungszentrum Jülich GmbH, Germany) for support in clearing leaves and making photographic images, Siegfried Werth for giving advice on photography, Dr. José Luis Micol (Universidad Miguel Hernández, Elche, Spain) for providing the hve-2 and ond3 mutant lines, and Kerstin Nagel (Institute of Bio- and Geosciences: Plant Sciences, Forschungszentrum Jülich GmbH, Germany) for providing access to the GROWSCREEN_ROOT software.
Glossary
- Col-0
Columbia-0
- Ler-0
Landsberg erecta-0
- ROI
region of interest
Footnotes
This work was supported by the German Federal Ministry of Education and Research (Project no. 031A053 for work at the German Plant Phenotyping Network), ALCUE-KBBE (Towards a Latin American and Caribbean Knowledge Based Bio-Economy in partnership with Europe, contract no. 264266), and the Cluster of Excellence on Plant Sciences (grant no. EXC 1028 to M.H.).
Articles can be viewed without a subscription.
References
- Alonso-Peral MM, Candela H, del Pozo JC, Martínez-Laborda A, Ponce MR, Micol JL (2006) The HVE/CAND1 gene is required for the early patterning of leaf venation in Arabidopsis. Development 133: 3755–3766 [DOI] [PubMed] [Google Scholar]
- Brodribb TJ, Feild TS, Jordan GJ (2007) Leaf maximum photosynthetic rate and venation are linked by hydraulics. Plant Physiol 144: 1890–1898 [DOI] [PMC free article] [PubMed] [Google Scholar]
- Carins Murphy MR, Jordan GJ, Brodribb TJ (2014) Acclimation to humidity modifies the link between leaf size and the density of veins and stomata. Plant Cell Environ 37: 124–131 [DOI] [PubMed] [Google Scholar]
- Dengler NG, Dengler RE, Donnelly PM, Hattersley PW (1994) Quantitative leaf anatomy of C3 and C4 grasses (Poaceae): bundle sheath and mesophyll surface area relationships. Ann Bot 73: 241–255 [Google Scholar]
- Dhondt S, Van Haerenborgh D, Van Cauwenbergh C, Merks RMH, Philips W, Beemster GTS, Inzé D (2012) Quantitative analysis of venation patterns of Arabidopsis leaves by supervised image analysis. Plant J 69: 553–563 [DOI] [PubMed] [Google Scholar]
- Dirnberger M, Neumann A, Kehl T (2015) NEFI: network extraction from images. arXiv 1502.0524: 1–15 [DOI] [PMC free article] [PubMed] [Google Scholar]
- Dorst L, Smeulders AWM (1987) Length estimators for digitized contours. Comput Vis Graph Image Process 40: 311–333 [Google Scholar]
- Feild TS, Brodribb TJ (2013) Hydraulic tuning of vein cell microstructure in the evolution of angiosperm venation networks. New Phytol 199: 720–726 [DOI] [PubMed] [Google Scholar]
- Feldman AB, Murchie EH, Leung H, Baraoidan M, Coe R, Yu SM, Lo SF, Quick WP (2014) Increasing leaf vein density by mutagenesis: laying the foundations for C4 rice. PLoS One 9: e94947. [DOI] [PMC free article] [PubMed] [Google Scholar]
- Fiorin L, Brodribb TJ, Anfodillo T (July 30, 2015) Transport efficiency through uniformity: organization of veins and stomata in angiosperm leaves. New Phytol 10.1111/nph.13577 [DOI] [PubMed] [Google Scholar]
- Frangi AF, Niessen WJ, Vincken KL, Viergever MA (1998) Multiscale vessel enhancement filtering. In Medical Image Computing and Computer-Assisted Interventation—MICCAI’98. Springer, Berlin, pp 130–137 [Google Scholar]
- Gowik U, Westhoff P (2011) The path from C3 to C4 photosynthesis. Plant Physiol 155: 56–63 [DOI] [PMC free article] [PubMed] [Google Scholar]
- Iwakawa H, Ueno Y, Semiarti E, Onouchi H, Kojima S, Tsukaya H, Hasebe M, Soma T, Ikezaki M, Machida C, et al. (2002) The ASYMMETRIC LEAVES2 gene of Arabidopsis thaliana, required for formation of a symmetric flat leaf lamina, encodes a member of a novel family of proteins characterized by cysteine repeats and a leucine zipper. Plant Cell Physiol 43: 467–478 [DOI] [PubMed] [Google Scholar]
- Levenberg K. (1944) A method for the solution of certain non-linear problems in least squares. Q Appl Math 2: 164–168 [Google Scholar]
- Lobet G, Draye X, Périlleux C (2013) An online database for plant image analysis software tools. Plant Methods 9: 38. [DOI] [PMC free article] [PubMed] [Google Scholar]
- Malinowski R. (2013) Understanding of leaf development—the science of complexity. Plants 2: 396–415 [DOI] [PMC free article] [PubMed] [Google Scholar]
- Marquardt DW. (1963) An algorithm for least-squares estimation of nonlinear parameters. J Soc Indust Appl Math 11: 431–441 [Google Scholar]
- McKown AD, Dengler NG (2009) Shifts in leaf vein density through accelerated vein formation in C4 Flaveria (Asteraceae). Ann Bot (Lond) 104: 1085–1098 [DOI] [PMC free article] [PubMed] [Google Scholar]
- Nagel KA, Kastenholz B, Jahnke S, Van Dusschoten D, Aach T, Mühlich M, Truhn D, Scharr H, Terjung S, Walter A, et al. (2009) Temperature responses of roots: impact on growth, root system architecture and implications for phenotyping. Funct Plant Biol 36: 947–959 [DOI] [PubMed] [Google Scholar]
- Onoda Y, Westoby M, Adler PB, Choong AM, Clissold FJ, Cornelissen JH, Díaz S, Dominy NJ, Elgart A, Enrico L, et al. (2011) Global patterns of leaf mechanical properties. Ecol Lett 14: 301–312 [DOI] [PubMed] [Google Scholar]
- Parsons-Wingerter P, Vickerman MB, Paul AL, Ferl RJ (2014) Mapping by VESGEN of leaf venation patterning in Arabidopsis with bioinformatic dimensions of gene expression. Gravit Space Res 2: 68–81 [Google Scholar]
- Pérez-Pérez JM, Rubio-Díaz S, Dhondt S, Hernández-Romero D, Sánchez-Soriano J, Beemster GTS, Ponce MR, Micol JL (2011) Whole organ, venation and epidermal cell morphological variations are correlated in the leaves of Arabidopsis mutants. Plant Cell Environ 34: 2200–2211 [DOI] [PubMed] [Google Scholar]
- Press WH. (2007) Numerical Recipes: The Art of Scientific Computing, Ed 3 Cambridge University Press, Cambridge, United Kingdom [Google Scholar]
- Price CA, Munro PRT, Weitz JS (2014) Estimates of leaf vein density are scale dependent. Plant Physiol 164: 173–180 [DOI] [PMC free article] [PubMed] [Google Scholar]
- Price CA, Symonova O, Mileyko Y, Hilley T, Weitz JS (2011) Leaf extraction and analysis framework graphical user interface: segmenting and analyzing the structure of leaf veins and areoles. Plant Physiol 155: 236–245 [DOI] [PMC free article] [PubMed] [Google Scholar]
- Price CA, Wing S, Weitz JS (2012) Scaling and structure of dicotyledonous leaf venation networks. Ecol Lett 15: 87–95 [DOI] [PubMed] [Google Scholar]
- Robles P, Fleury D, Candela H, Cnops G, Alonso-Peral MM, Anami S, Falcone A, Caldana C, Willmitzer L, Ponce MR, et al. (2010) The RON1/FRY1/SAL1 gene is required for leaf morphogenesis and venation patterning in Arabidopsis. Plant Physiol 152: 1357–1372 [DOI] [PMC free article] [PubMed] [Google Scholar]
- Rolland-Lagan AG, Amin M, Pakulska M (2009) Quantifying leaf venation patterns: two-dimensional maps. Plant J 57: 195–205 [DOI] [PubMed] [Google Scholar]
- Roschzttardtz H, Paez-Valencia J, Dittakavi T, Jali S, Reyes FC, Baisa G, Anne P, Gissot L, Palauqui JC, Masson PH, et al. (2014) The VASCULATURE COMPLEXITY AND CONNECTIVITY gene encodes a plant-specific protein required for embryo provasculature development. Plant Physiol 166: 889–902 [DOI] [PMC free article] [PubMed] [Google Scholar]
- Russ JC. (2011) The Image Processing Handbook, Ed 6 CRC Press, Boca Raton, FL [Google Scholar]
- Sack L, Caringella M, Scoffoni C, Mason C, Rawls M, Markesteijn L, Poorter L (2014) Leaf vein length per unit area is not intrinsically dependent on image magnification: avoiding measurement artifacts for accuracy and precision. Plant Physiol 166: 829–838 [DOI] [PMC free article] [PubMed] [Google Scholar]
- Sack L, Holbrook NM (2006) Leaf hydraulics. Annu Rev Plant Biol 57: 361–381 [DOI] [PubMed] [Google Scholar]
- Sack L, Scoffoni C (2013) Leaf venation: structure, function, development, evolution, ecology and applications in the past, present and future. New Phytol 198: 983–1000 [DOI] [PubMed] [Google Scholar]
- Sato Y, Nakajima S, Atsumi H, Koller T, Gerig G, Yoshida S, Kikinis R (1997) 3D Multi-Scale Line Filter for Segmentation and Visualization of Curvilinear Structures in Medical Images. CVRMed-MRCAS’97. Springer, Berlin, pp 213–222 [DOI] [PubMed] [Google Scholar]
- Scoffoni C, Kunkle J, Pasquet-Kok J, Vuong C, Patel AJ, Montgomery RA, Givnish TJ, Sack L (2015) Light-induced plasticity in leaf hydraulics, venation, anatomy, and gas exchange in ecologically diverse Hawaiian lobeliads. New Phytol 207: 43–58 [DOI] [PubMed] [Google Scholar]
- Selle D, Preim B, Schenk A, Peitgen HO (2002) Analysis of vasculature for liver surgical planning. IEEE Trans Med Imaging 21: 1344–1357 [DOI] [PubMed] [Google Scholar]
- Semiarti E, Ueno Y, Tsukaya H, Iwakawa H, Machida C, Machida Y (2001) The ASYMMETRIC LEAVES2 gene of Arabidopsis thaliana regulates formation of a symmetric lamina, establishment of venation and repression of meristem-related homeobox genes in leaves. Development 128: 1771–1783 [DOI] [PubMed] [Google Scholar]
- Vickerman MB, Keith PA, McKay TL, Gedeon DJ, Watanabe M, Montano M, Karunamuni G, Kaiser PK, Sears JE, Ebrahem Q, et al. (2009) VESGEN 2D: automated, user-interactive software for quantification and mapping of angiogenic and lymphangiogenic trees and networks. Anat Rec (Hoboken) 292: 320–332 [DOI] [PMC free article] [PubMed] [Google Scholar]
- Xiong D, Yu T, Zhang T, Li Y, Peng S, Huang J (2015) Leaf hydraulic conductance is coordinated with leaf morpho-anatomical traits and nitrogen status in the genus Oryza. J Exp Bot 66: 741–748 [DOI] [PMC free article] [PubMed] [Google Scholar]
- Zhang SB, Guan ZJ, Sun M, Zhang JJ, Cao KF, Hu H (2012) Evolutionary association of stomatal traits with leaf vein density in Paphiopedilum, Orchidaceae. PLoS One 7: e40080. [DOI] [PMC free article] [PubMed] [Google Scholar]
Associated Data
This section collects any data citations, data availability statements, or supplementary materials included in this article.


