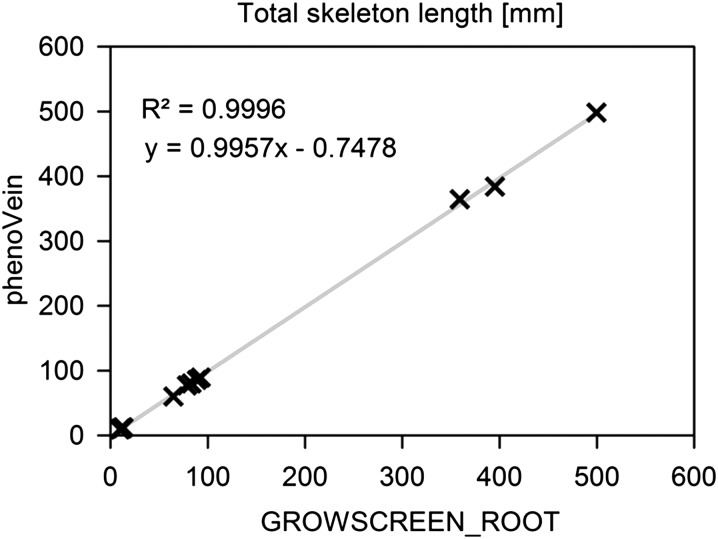
Figure 5.
Validation of length measurement of phenoVein. Veins of cotyledons and leaves 1 + 2 and 6 (Col-0) were segmented using phenoVein and compared with a manual segmentation feature of the root image analysis software package GROWSCREEN_ROOT (Nagel et al., 2009). The total length measured by phenoVein was fitted linearly to the data from GROWSCREEN_ROOT (gray curve); the fitting parameters are shown in the respective linear function.

