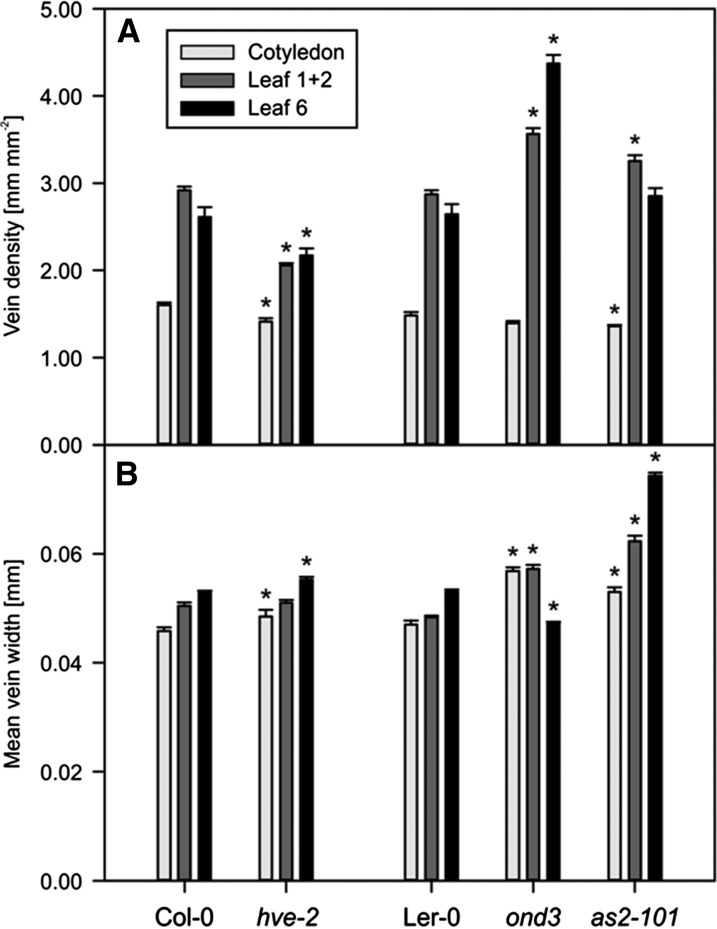
Figure 9.
Major results of analysis of leaves of Arabidopsis wild types and mutants for cotyledons, leaves 1 + 2, and leaf 6. A, Vein density distribution. Error bars indicate se (n = 10). B, Mean vein widths. Means were calculated from widths of all vein pieces (pooled) of 10 leaves for each genotype weighted by individual vein piece length. Error bars indicate se. *, Statistically significant differences (P < 0.05) comparing a mutant line with its corresponding wild type: hve-2 versus Col-0 and ond3/as2-101 versus Ler-0 (Table II).

