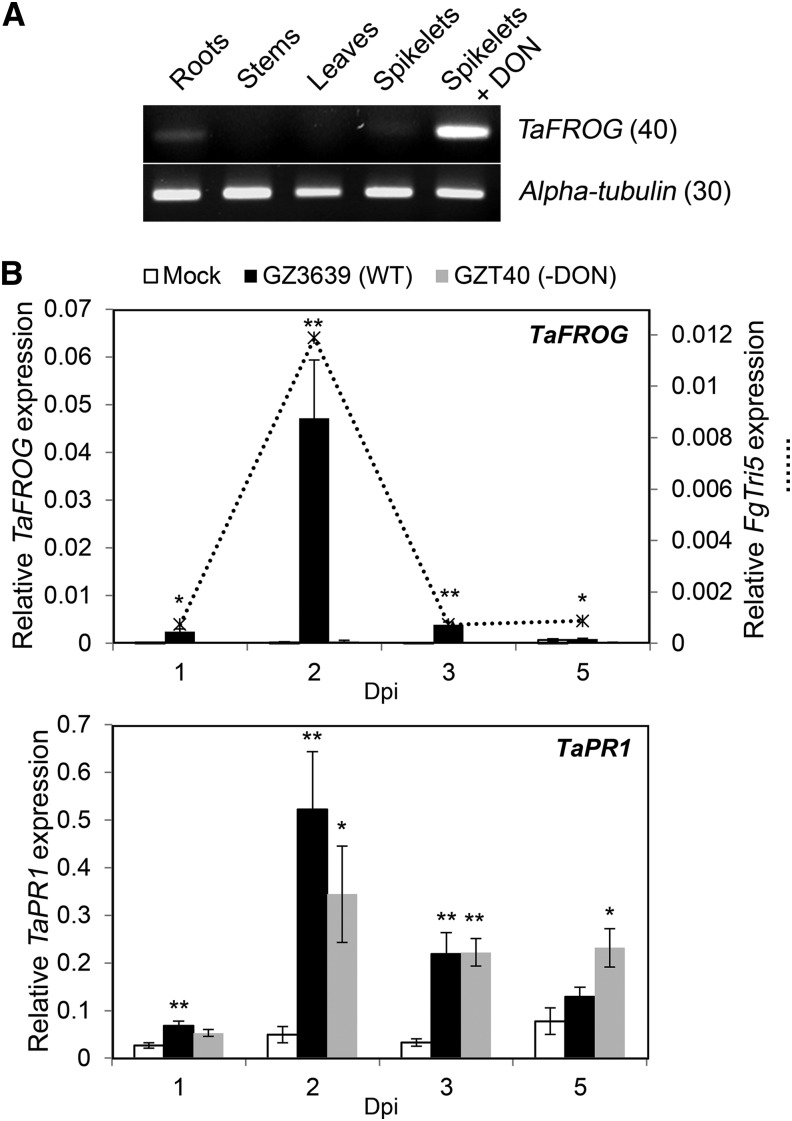
Figure 2.
TaFROG transcript levels in wheat tissues after treatment with DON or F. graminearum. A, Tissues at different wheat development stages and flowering spikelets treated with DON. After 24 h, TaFROG gene expression was assessed via sqRT-PCR (number in parenthesis = number of PCR cycles). B, TaFROG, FgTri5 (top graph) and TaPR1 (bottom graph) gene expression in wheat heads treated with F. graminearum was assessed via qRT-PCR. The wheat alpha-tubulin and F. graminearum FgActin genes were used as internal reference to calculate the relative expression of FgTri5 and TaFROG genes respectively, using the equation 2-(Ct target gene – Ct housekeeping gene). Wheat spikelets were treated with wild-type (WT) F. graminearum GZ3639, its DON-minus mutant derivative GZT40, or mock. The tissues were harvested at various days postinoculation as indicated. Results represent the mean (two biological replicates and four technical replicates per treatment from a pooled biological sample) and error bars indicate ±sem (n = 8). Asterisks show significant differences between treatments and mock (Kruskal-Wallis test; *, P < 0.05; and **, P < 0.01).

