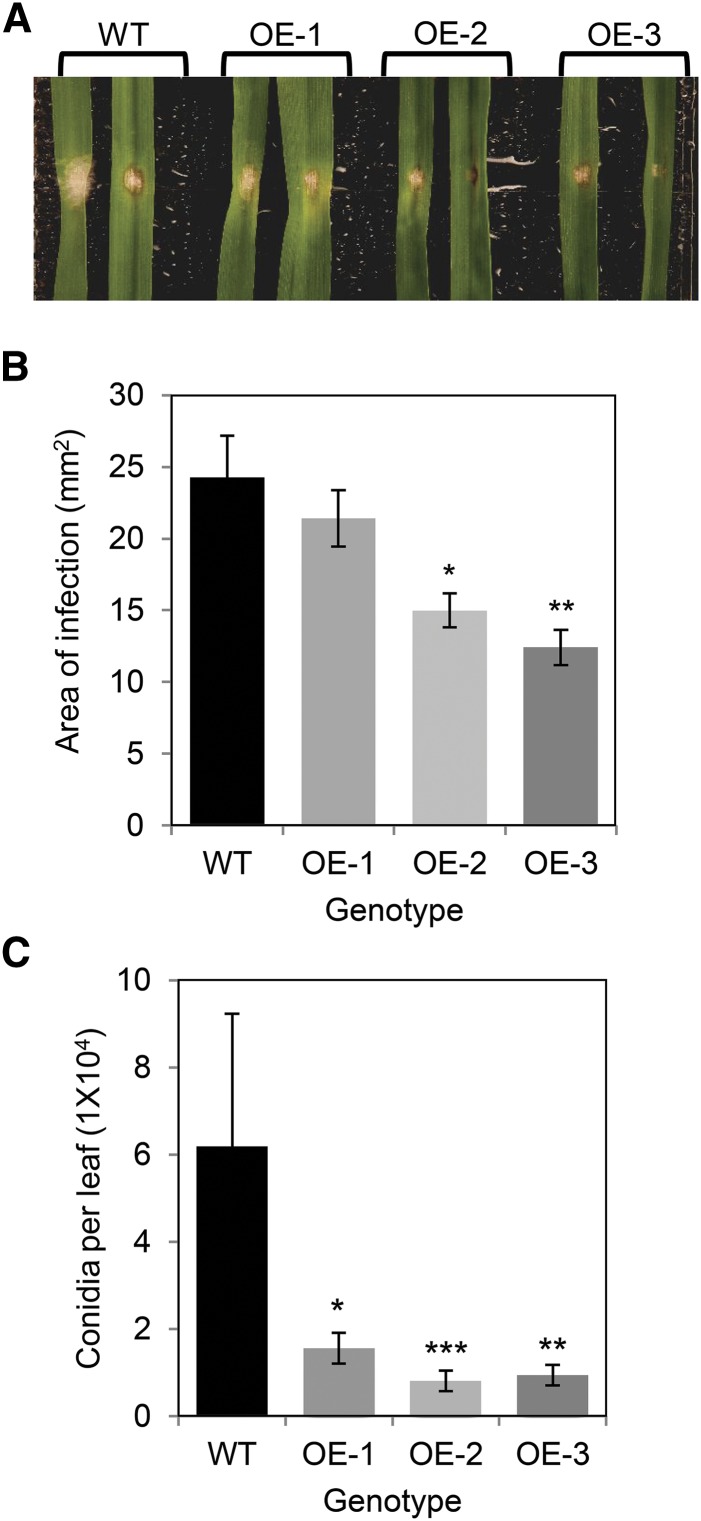
Figure 4.
Effect of TaFROG overexpression on wheat leaf resistance to F. graminearum. TaFROG overexpressor lines (OE-1, OE-2, and OE-3) and control plants (wild type [WT]) were used for phenotypic analysis. Representative leaf symptoms (A), diseased leaf area (B), and conidia production (C) were determined 4 d post-treatment of detached wheat leaves with F. graminearum. Error bars indicate ±sem (B and C: n = 36). Asterisks show significant differences compared with the wild type (B: Tukey's honestly significant difference test; C: Mann-Whitney U test; *, P < 0.05; **, P < 0.01; and ***, P < 0.001).

