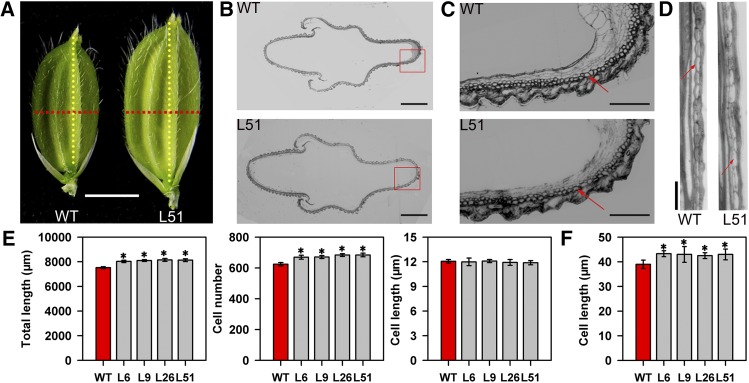
Figure 4.
Histological analyses of spikelet hulls just before heading in wild-type (WT) and pPP2::AtSUC2 rice plants. A, Representative spikelets of wild-type and transgenic plants. Red and yellow dotted lines indicate positions of cross and longitudinal sections, respectively. Bars = 3 mm. B, Cross sections of spikelet hulls in wild-type and transgenic plants. Bars = 500 μm. C, Magnified views of spikelet hull cross sections boxed in B. Arrow shows the outer parenchyma cell layer. Bars = 150 μm. D, Magnified views of spikelet hull longitudinal sections in wild-type and transgenic plants. Arrow shows a parenchyma cell of the lemma. Bars = 50 μm. E, Comparison of total length, cell number, and mean cell length of the outer parenchyma cell layers of spikelet hulls in wild-type and transgenic plants (n = 10 spikelets). F, Comparison of parenchyma cell lengths in the lemma of spikelet hulls in wild-type and transgenic plants (n = 10 spikelets). All data are given as means ± sd. Asterisks indicate significant difference from the wild type (*, P < 0.05). A Student’s t test was used to generate the P values.

