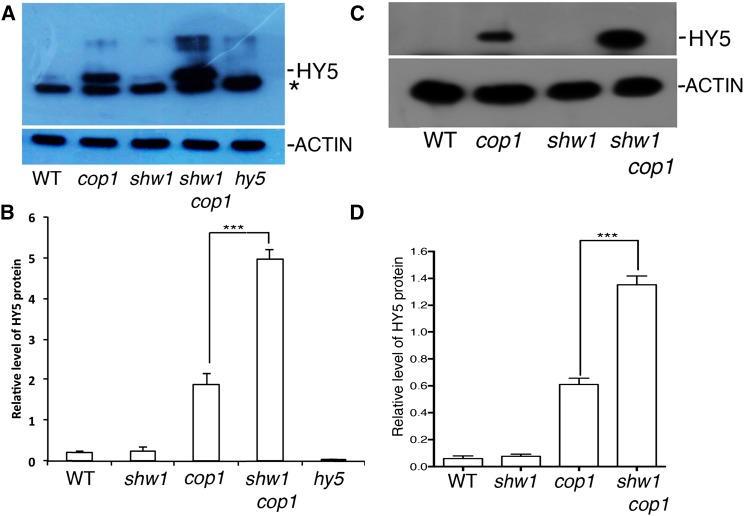
Figure 5.
HY5 accumulates at a higher level in shw1 cop1 compared with cop1. A, Immunoblot shows HY5 protein levels in wild-type (WT) and cop1, shw1, shw1 cop1, and hy5 mutant seedlings (6-d-old constant dark-grown seedlings). ACTIN bands show the loading control. Total protein was separated on an 8% (w/v) SDS-PAGE gel, blotted onto a polyvinylidene difluoride membrane, and probed with anti-HY5 antibody. *, Cross reacting bands. B, Quantitation of the accumulated HY5 level in the wild type and different mutant lines as in A. Results presented are obtained from three biological repeats. Error bars indicate sd. The Student’s t tests show the significant differences. ***, P < 0.001. C, Immunoblot shows HY5 protein levels in wild-type and cop1, shw1, and shw1 cop1 mutant seedlings (4-d-old WL-grown seedlings were transferred to dark for 2 d). For experimental details, see above. D, Quantitation of the accumulated HY5 level in the wild type and different mutant lines as in C. Results presented are obtained from three biological repeats. Error bars indicate sd. The Student’s t test shows the significant differences. ***, P < 0.001.

