Figure 8.
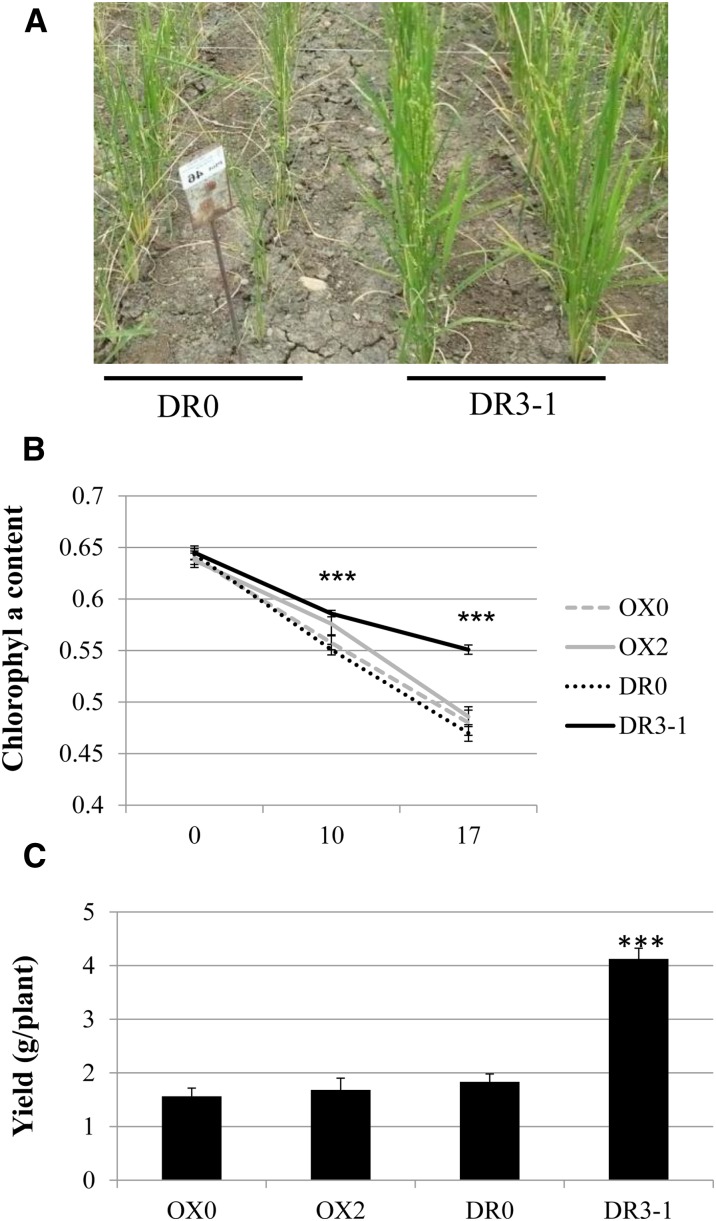
OsMADS26 DR confers tolerance to water deficit under field conditions. Plants were grown in the field at the International Center for Tropical Agriculture, and a drought stress was applied (“Materials and Methods”). The shape of the plant 17 d after stress is shown (A), and the chlorophyll fluorescence (B) was measured at the indicated times after stress in three independent blocks on three plants. Yield was measured at the end of the experiment (C). The means and sd are shown, and a Student’s t test (n = 9) was used to evaluate statistical difference between the overexpressing OX2 and down-regulated DR3-1 transgenic lines with their respective controls OX0 and DR0. ***, P < 0.001.

